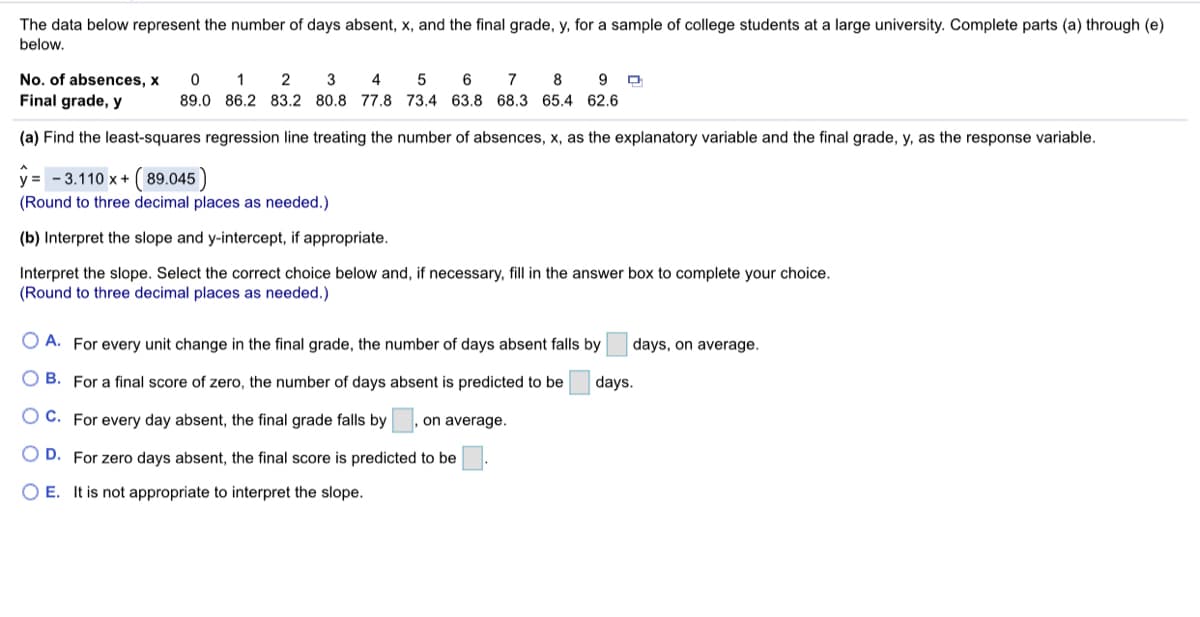
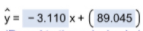
The data below represent the number of days absent, x, and the final grade, y, for a sample of college students at a large university. Complete parts (a) through (e) below. No. of absences, x Final grade, y 0 1 2 3 4 5 7 8 89.0 86.2 83.2 80.8 77.8 73.4 63.8 68.3 65.4 62.6 (a) Find the least-squares regression line treating the number of absences, x, as the explanatory variable and the final grade, y, as the response variable. y = - 3.110 x+ (89.045) (Round to three decimal places as needed.) (b) Interpret the slope and y-intercept, if appropriate. Interpret the slope. Select the correct choice below and, if necessary, fill in the answer box to complete your choice. (Round to three decimal places as needed.) O A. For every unit change in the final grade, the number of days absent falls by days, on average. O B. For a final score of zero, the number of days absent is predicted to be days. O C. For every day absent, the final grade falls by on average. O D. For zero days absent, the final score is predicted to be O E. It is not appropriate to interpret the slope.


Correlation
Correlation defines a relationship between two independent variables. It tells the degree to which variables move in relation to each other. When two sets of data are related to each other, there is a correlation between them.
Linear Correlation
A correlation is used to determine the relationships between numerical and categorical variables. In other words, it is an indicator of how things are connected to one another. The correlation analysis is the study of how variables are related.
Regression Analysis
Regression analysis is a statistical method in which it estimates the relationship between a dependent variable and one or more independent variable. In simple terms dependent variable is called as outcome variable and independent variable is called as predictors. Regression analysis is one of the methods to find the trends in data. The independent variable used in Regression analysis is named Predictor variable. It offers data of an associated dependent variable regarding a particular outcome.
Given that

Also part (a) is solved with the regression equation

Trending now
This is a popular solution!

Step by step
Solved in 2 steps with 2 images


