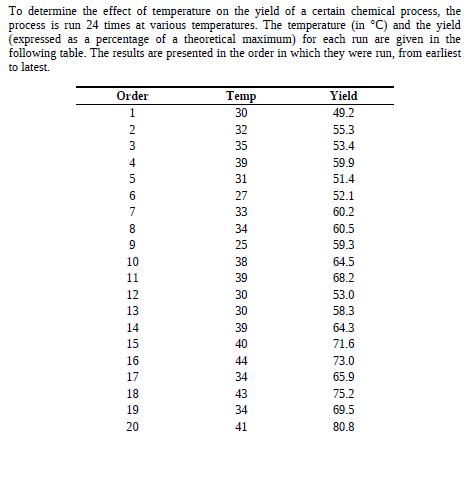
To determine the effect of temperature on the yield of a certain chemical process, the process is run 24 times at various temperatures. The temperature (in °C) and the yield (expressed as a percentage of a theoretical maximum) for each run are given in the following table. The results are presented in the order in which they were run, from earliest to latest. Order Temp Yield 30 49.2 32 55.3 3 35 53.4 4 39 59.9 31 51.4 27 52.1 33 60.2 34 60.5 25 59.3 10 38 64.5 11 39 68.2 12 30 53.0 13 30 58.3 14 39 64.3 15 40 71.6 16 44 73.0 17 34 65.9 18 43 75.2 19 34 69.5 20 41 80.8 21 22 23 24 36 37 42 28 78.6 77.2 80.3 69.5 Compute the least-squares line for predicting yield (y) from temperature (x). b. Plot the residuals versus the fitted values. Does the linear model seem appropriate? Explain. Plot the residuals versus the order in which the observations were made. Is there a a. C. trend in the residuals over time? Does the linear model seem appropriate? Explain.
To determine the effect of temperature on the yield of a certain chemical process, the process is run 24 times at various temperatures. The temperature (in °C) and the yield (expressed as a percentage of a theoretical maximum) for each run are given in the following table. The results are presented in the order in which they were run, from earliest to latest. Order Temp Yield 30 49.2 32 55.3 3 35 53.4 4 39 59.9 31 51.4 27 52.1 33 60.2 34 60.5 25 59.3 10 38 64.5 11 39 68.2 12 30 53.0 13 30 58.3 14 39 64.3 15 40 71.6 16 44 73.0 17 34 65.9 18 43 75.2 19 34 69.5 20 41 80.8 21 22 23 24 36 37 42 28 78.6 77.2 80.3 69.5 Compute the least-squares line for predicting yield (y) from temperature (x). b. Plot the residuals versus the fitted values. Does the linear model seem appropriate? Explain. Plot the residuals versus the order in which the observations were made. Is there a a. C. trend in the residuals over time? Does the linear model seem appropriate? Explain.

Linear Algebra: A Modern Introduction
4th Edition
ISBN:9781285463247
Author:David Poole
Publisher:David Poole
Chapter4: Eigenvalues And Eigenvectors
Section4.6: Applications And The Perron-frobenius Theorem
Problem 25EQ

Related questions
Question
Transcribed Image Text:To determine the effect of temperature on the yield of a certain chemical process, the
process is run 24 times at various temperatures. The temperature (in °C) and the yield
(expressed as a percentage of a theoretical maximum) for each run are given in the
following table. The results are presented in the order in which they were run, from earliest
to latest.
Order
Temp
Yield
30
49.2
32
55.3
3
35
53.4
4
39
59.9
31
51.4
27
52.1
33
60.2
34
60.5
25
59.3
10
38
64.5
11
39
68.2
12
30
53.0
13
30
58.3
14
39
64.3
15
40
71.6
16
44
73.0
17
34
65.9
18
43
75.2
19
34
69.5
20
41
80.8
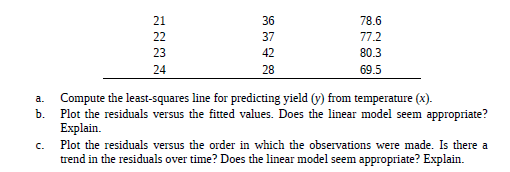
Transcribed Image Text:21
22
23
24
36
37
42
28
78.6
77.2
80.3
69.5
Compute the least-squares line for predicting yield (y) from temperature (x).
b. Plot the residuals versus the fitted values. Does the linear model seem appropriate?
Explain.
Plot the residuals versus the order in which the observations were made. Is there a
a.
C.
trend in the residuals over time? Does the linear model seem appropriate? Explain.
Expert Solution
This question has been solved!
Explore an expertly crafted, step-by-step solution for a thorough understanding of key concepts.

This is a popular solution!

Trending now
This is a popular solution!

Step by step
Solved in 2 steps with 6 images

Recommended textbooks for you
Linear Algebra: A Modern Introduction
Algebra
ISBN:
9781285463247
Author:
David Poole
Publisher:
Cengage Learning
Linear Algebra: A Modern Introduction
Algebra
ISBN:
9781285463247
Author:
David Poole
Publisher:
Cengage Learning