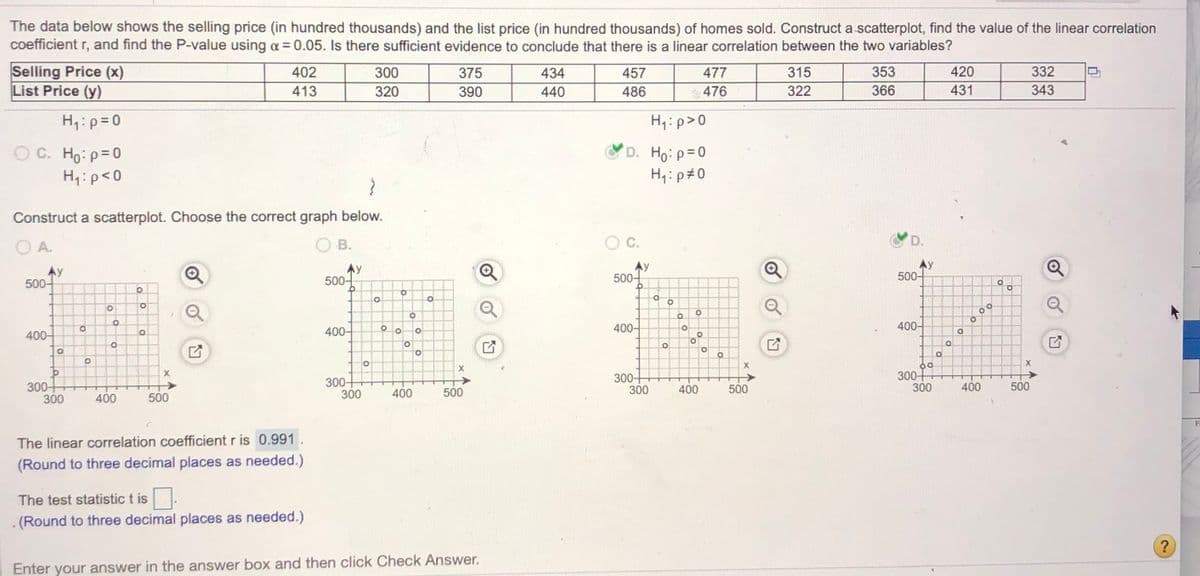
The data below shows the selling price (in hundred thousands) and the list price (in hundred thousands) of homes sold. Construct a scatterplot, find the value of the linear correlation coefficient r, and find the P-value using a = 0.05. Is there sufficient evidence to conclude that there is a linear correlation between the two variables? Selling Price (x) List Price (y) 402 300 375 434 457 477 315 353 420 332 413 320 390 440 486 476 322 366 431 343
The data below shows the selling price (in hundred thousands) and the list price (in hundred thousands) of homes sold. Construct a scatterplot, find the value of the linear correlation coefficient r, and find the P-value using a = 0.05. Is there sufficient evidence to conclude that there is a linear correlation between the two variables? Selling Price (x) List Price (y) 402 300 375 434 457 477 315 353 420 332 413 320 390 440 486 476 322 366 431 343

Big Ideas Math A Bridge To Success Algebra 1: Student Edition 2015
1st Edition
ISBN:9781680331141
Author:HOUGHTON MIFFLIN HARCOURT
Publisher:HOUGHTON MIFFLIN HARCOURT
Chapter4: Writing Linear Equations
Section: Chapter Questions
Problem 11CT

Related questions
Topic Video
Question
Please explain the test statistic t
Transcribed Image Text:The data below shows the selling price (in hundred thousands) and the list price (in hundred thousands) of homes sold. Construct a scatterplot, find the value of the linear correlation
coefficient r, and find the P-value using a = 0.05. Is there sufficient evidence to conclude that there is a linear correlation between the two variables?
Selling Price (x)
List Price (y)
402
300
375
434
457
477
315
353
420
332
413
320
390
440
486
476
322
366
431
343
H:p=0
H;:p>0
D. Ho: p=0
O C. Ho: p=0
H4:p<0
H;:p#0
Construct a scatterplot. Choose the correct graph below.
A.
B.
C.
D.
Ay
500-
Ay
500-
Ay
500-
500-
400-
400-
400-
400-
300
300
300-
300
300
300
300-
300
400
500
400
500
400
500
400
500
The linear correlation coefficient r is 0.991.
(Round to three decimal places as needed.)
The test statistic t is
. (Round to three decimal places as needed.)
?
Enter your answer in the answer box and then click Check Answer.
Expert Solution
This question has been solved!
Explore an expertly crafted, step-by-step solution for a thorough understanding of key concepts.

This is a popular solution!

Trending now
This is a popular solution!

Step by step
Solved in 2 steps with 1 images

Knowledge Booster


Learn more about
Need a deep-dive on the concept behind this application? Look no further. Learn more about this topic, statistics and related others by exploring similar questions and additional content below.Recommended textbooks for you
Big Ideas Math A Bridge To Success Algebra 1: Stu…
Algebra
ISBN:
9781680331141
Author:
HOUGHTON MIFFLIN HARCOURT
Publisher:
Houghton Mifflin Harcourt

Glencoe Algebra 1, Student Edition, 9780079039897…
Algebra
ISBN:
9780079039897
Author:
Carter
Publisher:
McGraw Hill

Algebra and Trigonometry (MindTap Course List)
Algebra
ISBN:
9781305071742
Author:
James Stewart, Lothar Redlin, Saleem Watson
Publisher:
Cengage Learning
Big Ideas Math A Bridge To Success Algebra 1: Stu…
Algebra
ISBN:
9781680331141
Author:
HOUGHTON MIFFLIN HARCOURT
Publisher:
Houghton Mifflin Harcourt
Glencoe Algebra 1, Student Edition, 9780079039897…
Algebra
ISBN:
9780079039897
Author:
Carter
Publisher:
McGraw Hill
Algebra and Trigonometry (MindTap Course List)
Algebra
ISBN:
9781305071742
Author:
James Stewart, Lothar Redlin, Saleem Watson
Publisher:
Cengage Learning