Listed below are amounts of court income and salaries paid to the town justices. All amounts are in thousands of dollars. Construct a scatterplot, find the value of the linear correlation coefficient r, and find the P-value using a = 0.05. Is there sufficient evidence to conclude that there is a linear correlation between court incomes and justice salaries? Based on the results, does it appear that justices might profit by levying larger fines? Court Income Justice Salary 65.0 406.0 1566.0|1130.0| 271.0 252.0 111.0 155.0| 34.0 e 29 42 92 57 47 61 25 26 17 What are the null and alternative hypotheses? O A. Ho: p+0 O B. Ho: p=0 H:p=0 H:p<0 OC. Ho: p=0 O D. Ho: p=0 H:p>0 H: p#0 Construct a scatterplot. Choose the correct graph below. OA. OB. OC. OD. Justice Salary 100- AJustice Salary 100- Justice Salary 100- AJustice Salary 100- .. 50- 50. 50- 50 0 04 800 1600 1600 800 1600 800 1600 800 Court Income Court Income Court Income Court Income The linear correlation coefficient is r=. (Round to three decimal nlaces as needed
Listed below are amounts of court income and salaries paid to the town justices. All amounts are in thousands of dollars. Construct a scatterplot, find the value of the linear correlation coefficient r, and find the P-value using a = 0.05. Is there sufficient evidence to conclude that there is a linear correlation between court incomes and justice salaries? Based on the results, does it appear that justices might profit by levying larger fines? Court Income Justice Salary 65.0 406.0 1566.0|1130.0| 271.0 252.0 111.0 155.0| 34.0 e 29 42 92 57 47 61 25 26 17 What are the null and alternative hypotheses? O A. Ho: p+0 O B. Ho: p=0 H:p=0 H:p<0 OC. Ho: p=0 O D. Ho: p=0 H:p>0 H: p#0 Construct a scatterplot. Choose the correct graph below. OA. OB. OC. OD. Justice Salary 100- AJustice Salary 100- Justice Salary 100- AJustice Salary 100- .. 50- 50. 50- 50 0 04 800 1600 1600 800 1600 800 1600 800 Court Income Court Income Court Income Court Income The linear correlation coefficient is r=. (Round to three decimal nlaces as needed

Big Ideas Math A Bridge To Success Algebra 1: Student Edition 2015
1st Edition
ISBN:9781680331141
Author:HOUGHTON MIFFLIN HARCOURT
Publisher:HOUGHTON MIFFLIN HARCOURT
Chapter4: Writing Linear Equations
Section: Chapter Questions
Problem 11CT

Related questions

Concept explainers
Contingency Table
A contingency table can be defined as the visual representation of the relationship between two or more categorical variables that can be evaluated and registered. It is a categorical version of the scatterplot, which is used to investigate the linear relationship between two variables. A contingency table is indeed a type of frequency distribution table that displays two variables at the same time.
Binomial Distribution
Binomial is an algebraic expression of the sum or the difference of two terms. Before knowing about binomial distribution, we must know about the binomial theorem.
Topic Video
Question
2
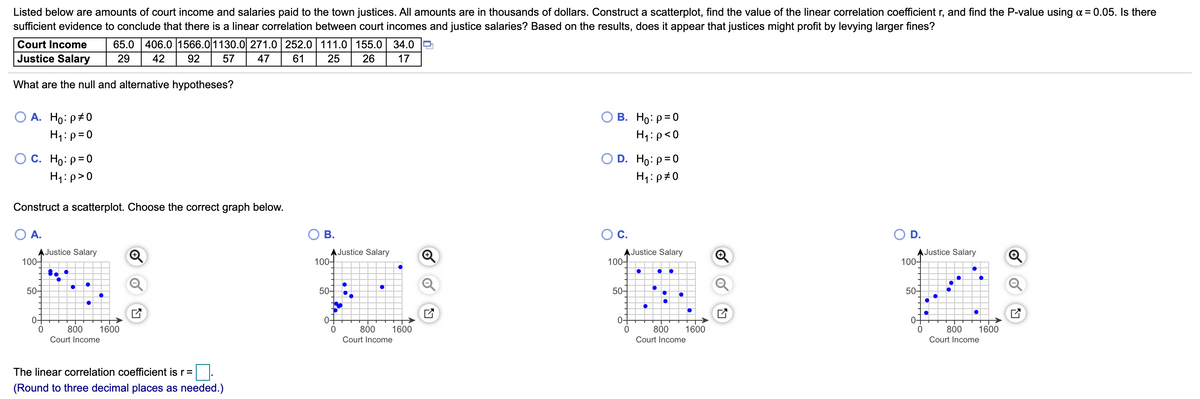
Transcribed Image Text:Listed below are amounts of court income and salaries paid to the town justices. All amounts are in thousands of dollars. Construct a scatterplot, find the value of the linear correlation coefficient r, and find the P-value using a = 0.05. Is there
sufficient evidence to conclude that there is a linear correlation between court incomes and justice salaries? Based on the results, does it appear that justices might profit by levying larger fines?
50- .
Court Income
65.0 406.0 1566.0 1130.0 271.0 252.0 111.0 155.0
34.0
Justice Salary
29
42
92
57
47
61
25
26
17
What are the null and alternative hypotheses?
А. Но: р#0
В. Но: р-0
H1:p=0
H:p<0
Ос. Но: р30
O D. Ho: p=0
H1:p>0
H4:p#0
Construct a scatterplot. Choose the correct graph below.
O A.
В.
Oc.
D.
A Justice Salary
100-
A Justice Salary
100-
Justice Salary
100-
AJustice Salary
100-
50-
50-
50-
0-
0-
800
1600
800
1600
800
1600
800
1600
Court Income
Court Income
Court Income
Court Income
The linear correlation coefficient is r=
(Round to three decimal places as needed.)
Expert Solution
This question has been solved!
Explore an expertly crafted, step-by-step solution for a thorough understanding of key concepts.

Step by step
Solved in 4 steps with 2 images

Knowledge Booster


Learn more about
Need a deep-dive on the concept behind this application? Look no further. Learn more about this topic, statistics and related others by exploring similar questions and additional content below.Recommended textbooks for you
Big Ideas Math A Bridge To Success Algebra 1: Stu…
Algebra
ISBN:
9781680331141
Author:
HOUGHTON MIFFLIN HARCOURT
Publisher:
Houghton Mifflin Harcourt

Glencoe Algebra 1, Student Edition, 9780079039897…
Algebra
ISBN:
9780079039897
Author:
Carter
Publisher:
McGraw Hill
Big Ideas Math A Bridge To Success Algebra 1: Stu…
Algebra
ISBN:
9781680331141
Author:
HOUGHTON MIFFLIN HARCOURT
Publisher:
Houghton Mifflin Harcourt
Glencoe Algebra 1, Student Edition, 9780079039897…
Algebra
ISBN:
9780079039897
Author:
Carter
Publisher:
McGraw Hill