Listed below are amounts of court income and salaries paid to the town justices. All amounts are in thousands of dollars, Construct a scatterplot, find the value of the linear correlation coefficient r, and find the P-value using a = 0.05. Is there sufficient evidence to conclude that there is a linear correlation between court incomes and justice salaries? Based on the results, does it appear that justices might profit by levying larger fines? %3D Court Income 64.0 404.0 1567.01130.0 271.0 254.0 112.0 154.0 30.0 Justice Salary 31 44 91 58 47 61 26 27 19 C...... What are the null and alternative hypotheses? O A. Ho p=0 H: p#0 O B. Ho: p=0 H,: p<0 O C. Ho p#0 H:p= 0 O D. Ho: p=0 H:p>0 Construct a scatterplot. Choose the correct graph below. O A. O B. OC. O D. AJustice Salary 100+ AJustice Salary 100- AJustice Salary A Justice Salary 100- 100+ O .. 50- 50- 504 50- 0- 0+ 0+ 0+ 800 1600 800 1600 800 1600 800 1600 Court Income Court Income Court Income Court Income The linear correlation coefficient is r = (Round to three decimal places as needed.) The test statistic is t = (Round to three decimal places as needed.) The P-value is. (Round to three decimal places as needed.) V than the significance level 0.05, there V sufficient evidence to support the claim that there is a Because the P-value is linear correlation between court incomes and justice salaries for a significance level of a = 0.05. Dennd an the rnulte denn itannaar thnt iuntinne michtnenfit h lenin-larr finaa?
Listed below are amounts of court income and salaries paid to the town justices. All amounts are in thousands of dollars, Construct a scatterplot, find the value of the linear correlation coefficient r, and find the P-value using a = 0.05. Is there sufficient evidence to conclude that there is a linear correlation between court incomes and justice salaries? Based on the results, does it appear that justices might profit by levying larger fines? %3D Court Income 64.0 404.0 1567.01130.0 271.0 254.0 112.0 154.0 30.0 Justice Salary 31 44 91 58 47 61 26 27 19 C...... What are the null and alternative hypotheses? O A. Ho p=0 H: p#0 O B. Ho: p=0 H,: p<0 O C. Ho p#0 H:p= 0 O D. Ho: p=0 H:p>0 Construct a scatterplot. Choose the correct graph below. O A. O B. OC. O D. AJustice Salary 100+ AJustice Salary 100- AJustice Salary A Justice Salary 100- 100+ O .. 50- 50- 504 50- 0- 0+ 0+ 0+ 800 1600 800 1600 800 1600 800 1600 Court Income Court Income Court Income Court Income The linear correlation coefficient is r = (Round to three decimal places as needed.) The test statistic is t = (Round to three decimal places as needed.) The P-value is. (Round to three decimal places as needed.) V than the significance level 0.05, there V sufficient evidence to support the claim that there is a Because the P-value is linear correlation between court incomes and justice salaries for a significance level of a = 0.05. Dennd an the rnulte denn itannaar thnt iuntinne michtnenfit h lenin-larr finaa?

Glencoe Algebra 1, Student Edition, 9780079039897, 0079039898, 2018
18th Edition
ISBN:9780079039897
Author:Carter
Publisher:Carter
Chapter4: Equations Of Linear Functions
Section4.5: Correlation And Causation
Problem 15PPS

Related questions
Question
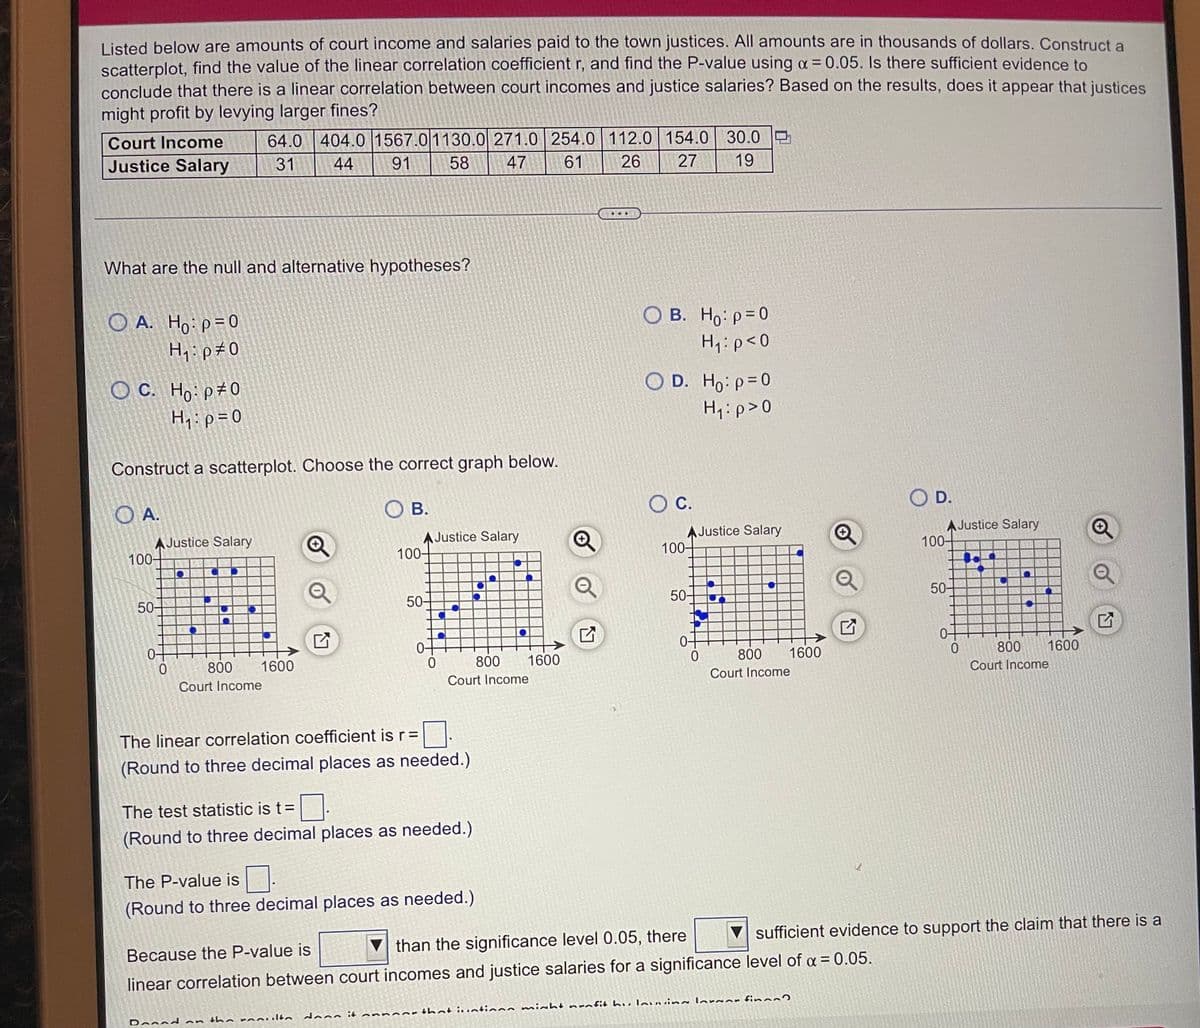
Transcribed Image Text:Listed below are amounts of court income and salaries paid to the town justices. All amounts are in thousands of dollars. Construct a
scatterplot, find the value of the linear correlation coefficient r, and find the P-value using a = 0.05. Is there sufficient evidence to
conclude that there is a linear correlation between court incomes and justice salaries? Based on the results, does it appear that justices
might profit by levying larger fines?
64.0 404.0 1567.01130.0 271.0 254.0 112.0 154.0 30.0 O
19
Court Income
Justice Salary
31
44
91
58
47
61
26
27
...
What are the null and alternative hypotheses?
O B. Ho: p=0
O A. Ho p=0
Hq:p#0
H1:p<0
О с. Но: р20
H,:p= 0
O D. Ho: p=0
H1:p>0
Construct a scatterplot. Choose the correct graph below.
C.
O D.
O A.
O B.
AJustice Salary
100-
AJustice Salary
100-
AJustice Salary
100-
AJustice Salary
100-
50-
50-
50-
50-
0-
800
1600
0-
800
1600
800
1600
800
1600
Court Income
Court Income
Court Income
Court Income
The linear correlation coefficient is r=
(Round to three decimal places as needed.)
The test statistic is t=
(Round to three decimal places as needed.)
The P-value is.
(Round to three decimal places as needed.)
V sufficient evidence to support the claim that there is a
than the significance level 0.05, there
Because the P-value is
linear correlation between court incomes and justice salaries for a significance level of a = 0.05.
inoort hat iuatinns miht nrafit h u lovvin lor an fin
dann it
Dennd an the rooulto
Expert Solution
This question has been solved!
Explore an expertly crafted, step-by-step solution for a thorough understanding of key concepts.

This is a popular solution!

Trending now
This is a popular solution!

Step by step
Solved in 3 steps with 2 images

Recommended textbooks for you
Glencoe Algebra 1, Student Edition, 9780079039897…
Algebra
ISBN:
9780079039897
Author:
Carter
Publisher:
McGraw Hill

Big Ideas Math A Bridge To Success Algebra 1: Stu…
Algebra
ISBN:
9781680331141
Author:
HOUGHTON MIFFLIN HARCOURT
Publisher:
Houghton Mifflin Harcourt
Glencoe Algebra 1, Student Edition, 9780079039897…
Algebra
ISBN:
9780079039897
Author:
Carter
Publisher:
McGraw Hill
Big Ideas Math A Bridge To Success Algebra 1: Stu…
Algebra
ISBN:
9781680331141
Author:
HOUGHTON MIFFLIN HARCOURT
Publisher:
Houghton Mifflin Harcourt