The data found below measure the amounts of greenhouse gas emissions from three types of vehicles. The measurements are in tons per year, expressed as CO02 equivalents. Use a 0.05 significance level to test the claim that the different types of vehicle have the same mean amount of greenhouse gas emissions. Based the results, does the type of vehicle appear to affect the amount of greenhouse gas emissions? E Click the icon to view the data What are the hypotheses for this test? O Data Table O A. Ho: At least one of the means is different from the others . OB. Hg P P2 * Ps H "P2"P OC. H P"P2"3 H: At least one of the means is different from the others. Туре А | Туре в | Туре С 7.3 8.7 8.2 89 82 76 8.4 7.4 8.4 7.7 8.3 7.9 83 7.4 8.2 9.2 77 OD. Hg: "P2 "P3 7.3 8.9 92 82 8.1 8.7 9.1 8.3 9.2 8.7 Determine the test statistic FRound to two decimal places as needed) Identify the P-value. Print Done P-value =D(Round to two decimal places as needed) What is the conclusion of the test? V the null hypothesis. Conclude that the type of vehicle V appear to affect the amount of greenhouse gas emissions for these three types.
The data found below measure the amounts of greenhouse gas emissions from three types of vehicles. The measurements are in tons per year, expressed as CO02 equivalents. Use a 0.05 significance level to test the claim that the different types of vehicle have the same mean amount of greenhouse gas emissions. Based the results, does the type of vehicle appear to affect the amount of greenhouse gas emissions? E Click the icon to view the data What are the hypotheses for this test? O Data Table O A. Ho: At least one of the means is different from the others . OB. Hg P P2 * Ps H "P2"P OC. H P"P2"3 H: At least one of the means is different from the others. Туре А | Туре в | Туре С 7.3 8.7 8.2 89 82 76 8.4 7.4 8.4 7.7 8.3 7.9 83 7.4 8.2 9.2 77 OD. Hg: "P2 "P3 7.3 8.9 92 82 8.1 8.7 9.1 8.3 9.2 8.7 Determine the test statistic FRound to two decimal places as needed) Identify the P-value. Print Done P-value =D(Round to two decimal places as needed) What is the conclusion of the test? V the null hypothesis. Conclude that the type of vehicle V appear to affect the amount of greenhouse gas emissions for these three types.

Glencoe Algebra 1, Student Edition, 9780079039897, 0079039898, 2018
18th Edition
ISBN:9780079039897
Author:Carter
Publisher:Carter
Chapter4: Equations Of Linear Functions
Section4.5: Correlation And Causation
Problem 11PPS

Related questions
Topic Video
Question
100%
The data found below measure the amounts of greenhouse gas emissions from three types of vehicles. The measurements are in tons per year, expressed as CO2 equivalents. Use a
0.05
significance level to test the claim that the different types of vehicle have the same mean amount of greenhouse gas emissions. Based on the results, does the type of vehicle appear to affect the amount of greenhouse gas emissions?
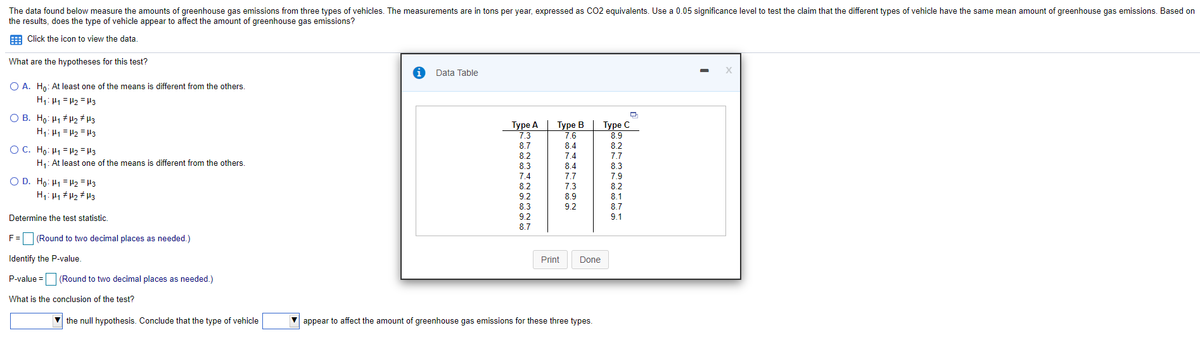
Transcribed Image Text:The data found below measure the amounts of greenhouse gas emissions from three types of vehicles. The measurements are in tons per year, expressed as CO2 equivalents. Use a 0.05 significance level to test the claim that the different types of vehicle have the same mean amount of greenhouse gas emissions. Based on
the results, does the type of vehicle appear to affect the amount of greenhouse gas emissions?
E Click the icon to view the data.
What are the hypotheses for this test?
Data Table
O A. Ho: At least one of the means is different from the others.
H1: H1 = H2 = Hl3
O B. Ho: H1 # H2 # H3
H1: H1 = H2 = H3
Туре А
7.3
Туре В
7.6
Туре C
8.9
8.7
8.4
8.2
O C. Họ: H1 = H2 = H3
8.2
7.4
7.7
H: At least one of the means is different from the others
8.3
8.4
8.3
7.4
7.7
7.9
O D. Ho: H1 = H2 = H3
8.2
7.3
8.2
9.2
8.9
8.1
8.3
9.2
8.7
Determine the test statistic.
9.2
9.1
8.7
F= (Round to two decimal places as needed.)
Identify the P-value.
Print
Done
P-value = (Round to two decimal places as needed.)
What is the conclusion of the test?
V the null hypothesis. Conclude that the type of vehicle
appear to affect the amount of greenhouse gas emissions for these three types.
Expert Solution
This question has been solved!
Explore an expertly crafted, step-by-step solution for a thorough understanding of key concepts.

This is a popular solution!

Trending now
This is a popular solution!

Step by step
Solved in 4 steps with 5 images

Knowledge Booster


Learn more about
Need a deep-dive on the concept behind this application? Look no further. Learn more about this topic, statistics and related others by exploring similar questions and additional content below.Recommended textbooks for you
Glencoe Algebra 1, Student Edition, 9780079039897…
Algebra
ISBN:
9780079039897
Author:
Carter
Publisher:
McGraw Hill
Glencoe Algebra 1, Student Edition, 9780079039897…
Algebra
ISBN:
9780079039897
Author:
Carter
Publisher:
McGraw Hill