The data found below measure the amounts of greenhouse gas emissions from three types of vehicles. The measurements are in tons per year, expressed as CO2 equivalents. Use a 0.025 significance level test the claim that the different types of vehicle have the same mean amount of greenhouse gas emissions. Based on the results, does the type of vehicle appear to affect the amount of greenhouse gas emissions? E Click the icon to view the data. What are the hypotheses for this test? i Data Table O A. Ho: H1 = H2 = H3 H: At least one of the means is different from the others. Туре А 6.2 Type B 8.2 7.3 Туре С O B. Ho: H1 # H2* H3 H: H1 =H2=H3 7.7 5.8 7.6 6.2 8.4 8.8 O C. Ho: H1 =H2= H3 H: Hi # H2#H3 5.7 7.8 8.8 6.9 8.8 9.3 6.1 7.7 8.1 O D. Ho: At least one of the means is different from the others. 7.9 5.7 5.9 5.6 7.3 7.3 7.8 H: H =2 = H3 8.1 5.6 Determine the test statistic. F= (Round to two decimal places as needed.) Print Done Identify the P-value. Click to select your answer(s). tv
The data found below measure the amounts of greenhouse gas emissions from three types of vehicles. The measurements are in tons per year, expressed as CO2 equivalents. Use a 0.025 significance level test the claim that the different types of vehicle have the same mean amount of greenhouse gas emissions. Based on the results, does the type of vehicle appear to affect the amount of greenhouse gas emissions? E Click the icon to view the data. What are the hypotheses for this test? i Data Table O A. Ho: H1 = H2 = H3 H: At least one of the means is different from the others. Туре А 6.2 Type B 8.2 7.3 Туре С O B. Ho: H1 # H2* H3 H: H1 =H2=H3 7.7 5.8 7.6 6.2 8.4 8.8 O C. Ho: H1 =H2= H3 H: Hi # H2#H3 5.7 7.8 8.8 6.9 8.8 9.3 6.1 7.7 8.1 O D. Ho: At least one of the means is different from the others. 7.9 5.7 5.9 5.6 7.3 7.3 7.8 H: H =2 = H3 8.1 5.6 Determine the test statistic. F= (Round to two decimal places as needed.) Print Done Identify the P-value. Click to select your answer(s). tv

Glencoe Algebra 1, Student Edition, 9780079039897, 0079039898, 2018
18th Edition
ISBN:9780079039897
Author:Carter
Publisher:Carter
Chapter10: Statistics
Section10.5: Comparing Sets Of Data
Problem 14PPS

Related questions
Topic Video
Question
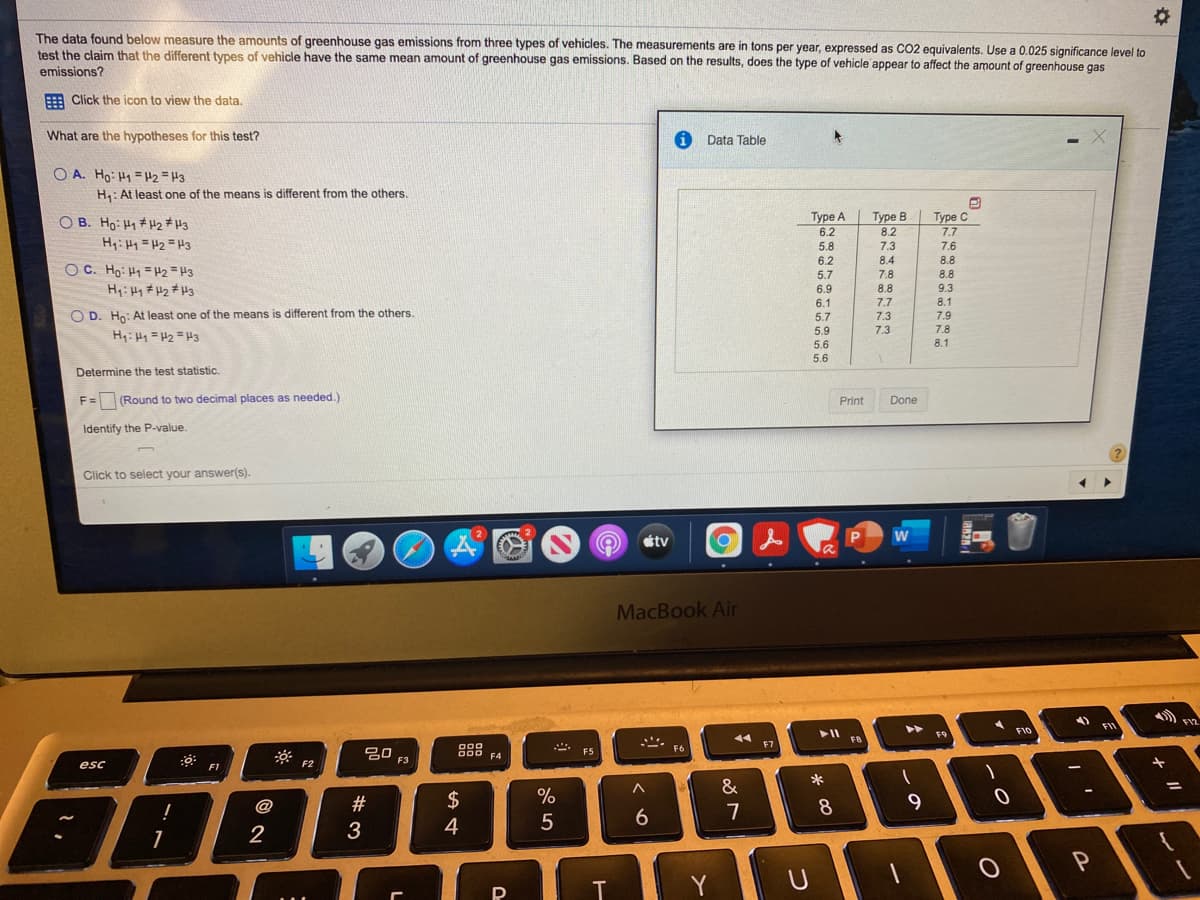
Transcribed Image Text:The data found below measure the amounts of greenhouse gas emissions from three types of vehicles. The measurements are in tons per year, expressed as CO2 equivalents. Use a 0.025 significance level to
test the claim that the different types of vehicle have the same mean amount of greenhouse gas emissions. Based on the results, does the type of vehicle appear to affect the amount of greenhouse gas
emissions?
: Click the icon to view the data.
What are the hypotheses for this test?
Data Table
O A. Ho: H1 = H2 =H3
H: At least one of the means is different from the others.
Туре с
O B. Ho: H1 # H2 * H3
Туре А
6.2
Type B
8.2
7.7
Hyi Hy = H2 =H3
5.8
7.3
7.6
6.2
8.4
8.8
OC. Ho: H1 = H2 = H3
H: H1 # H2 #H3
5.7
7.8
8.8
6.9
8.8
9.3
6.1
7.7
8.1
O D. Ho: At least one of the means is different from the others.
7.9
5.7
7.3
5.9
7.3
7.8
H: H1 =H2 = H3
5.6
8.1
5.6
Determine the test statistic.
F =
(Round to two decimal places as needed.)
Print
Done
Identify the P-value.
Click to select your answer(s).
w
éty
MacBook Air
FI
F9
F10
FB
F7
F6
吕0
F5
F4
esc
F1
F2
&
@
#
$
%
8
7
2
3
4
Y

Transcribed Image Text:The data found below measure the amounts of greenhouse gas emissions from three types of vehicles. The measurements are in tons per year, expressed as CO2 equivalents. Use a 0.025 significance level to
test the claim that the different types
emissions?
vehicle have the same mean amount of greenhouse gas emissions. Based on the results, does the type of vehicle appear to affect the amount of greenhouse gas
E Click the icon to view the data.
Data Table
O B. Ho: H1 H2 # H3
H: 44 =42=H3
O C. Ho: H1 = H2=H3
H: H # H2 #H3
Туре А
6.2
Туре В
Туре С
8.2
7.7
5.8
7.3
7.6
O D. Hn: At least one of the means is different from the others.
6.2
5.7
8.4
8.8
H: H1 =H2 = H3
7.8
8.8
6.9
8.8
9.3
6.1
7.7
8.1
Determine the test statistic.
5.7
7.3
7.9
5.9
7.3
7.8
(Round to two decimal places as needed.)
5.6
5.6
8.1
Identify the P-value.
P-value = (Round to two decimal places as needed.)
Print
Done
What is the conclusion of the test?
V appear to affect the amount of greenhouse gas emissions for these three types.
the null hypothesis. Conclude that the type of vehicle
Reject
Iswer(s).
Do not reject
étv
MacBook Air
►►
F1O
FI
F9
FB
F7
吕0
F5
F6
esc
F2
F3
F1
&
@
#
2$
8
9
7
2
3
4
5
Expert Solution
This question has been solved!
Explore an expertly crafted, step-by-step solution for a thorough understanding of key concepts.

This is a popular solution!

Trending now
This is a popular solution!

Step by step
Solved in 2 steps

Knowledge Booster


Learn more about
Need a deep-dive on the concept behind this application? Look no further. Learn more about this topic, statistics and related others by exploring similar questions and additional content below.Recommended textbooks for you
Glencoe Algebra 1, Student Edition, 9780079039897…
Algebra
ISBN:
9780079039897
Author:
Carter
Publisher:
McGraw Hill
Glencoe Algebra 1, Student Edition, 9780079039897…
Algebra
ISBN:
9780079039897
Author:
Carter
Publisher:
McGraw Hill