The data given below are temperature readings from a chemical process in °C, taken every two minutes. (Read the observations from left to right). The target value for the mean is μo=950. Chemical Process Temperature Data 940 952 935 959 955 950 959 934 953 985 949 937 959 948 958 952 972 955 966 954 948 955 947 928 (i) (ii) (iii) (iv) Estimate the process standard deviation using the moving ranges. It is decided to set up and apply a tabular CUSUM for this process in order to quickly detect if the mean shifted to 960 (thus the magnitude of the shift to be detected is 10). Use the value h = 5. Are there any points that are out of control? Set up and apply a tabular CUSUM for this process, using the same value of h and using a 50% head start. Are there any points that are out of control? Use a combined Shewhart-CUSUM scheme on the data, where the tabular CUSUM is used without any head start. Are there any points that are out of control? The Shewhart control chart to be used is the moving range chart.
The data given below are temperature readings from a chemical process in °C, taken every two minutes. (Read the observations from left to right). The target value for the mean is μo=950. Chemical Process Temperature Data 940 952 935 959 955 950 959 934 953 985 949 937 959 948 958 952 972 955 966 954 948 955 947 928 (i) (ii) (iii) (iv) Estimate the process standard deviation using the moving ranges. It is decided to set up and apply a tabular CUSUM for this process in order to quickly detect if the mean shifted to 960 (thus the magnitude of the shift to be detected is 10). Use the value h = 5. Are there any points that are out of control? Set up and apply a tabular CUSUM for this process, using the same value of h and using a 50% head start. Are there any points that are out of control? Use a combined Shewhart-CUSUM scheme on the data, where the tabular CUSUM is used without any head start. Are there any points that are out of control? The Shewhart control chart to be used is the moving range chart.

Mathematics For Machine Technology
8th Edition
ISBN:9781337798310
Author:Peterson, John.
Publisher:Peterson, John.
Chapter29: Tolerance, Clearance, And Interference
Section: Chapter Questions
Problem 16A: Spacers are manufactured to the mean dimension and tolerance shown in Figure 29-12. An inspector...

Related questions
Question
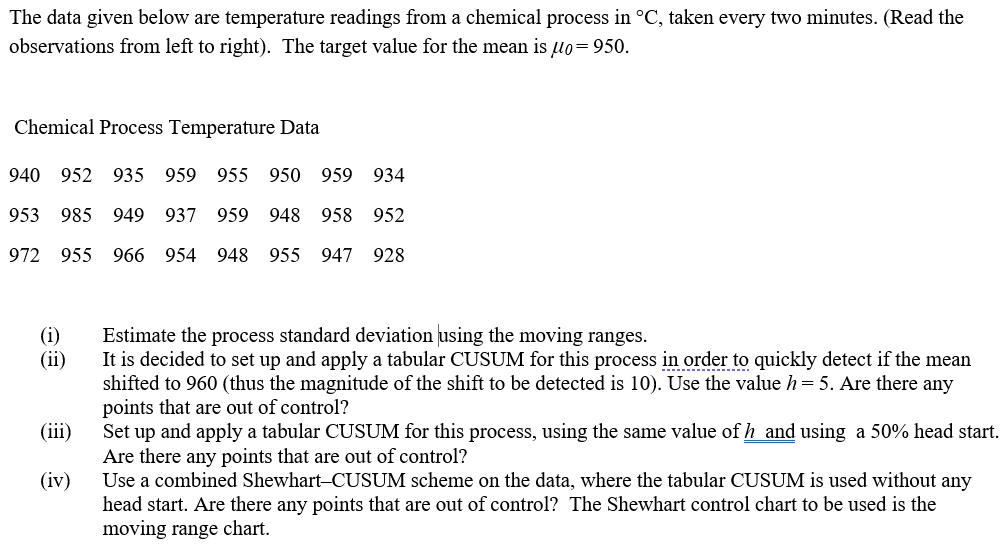
Transcribed Image Text:The data given below are temperature readings from a chemical process in °C, taken every two minutes. (Read the
observations from left to right). The target value for the mean is μo=950.
Chemical Process Temperature Data
940 952 935 959 955 950 959 934
953 985 949 937 959 948 958 952
972 955 966 954 948 955 947 928
(i)
(ii)
(iii)
(iv)
Estimate the process standard deviation using the moving ranges.
It is decided to set up and apply a tabular CUSUM for this process in order to quickly detect if the mean
shifted to 960 (thus the magnitude of the shift to be detected is 10). Use the value h = 5. Are there any
points that are out of control?
Set up and apply a tabular CUSUM for this process, using the same value of h and using a 50% head start.
Are there any points that are out of control?
Use a combined Shewhart-CUSUM scheme on the data, where the tabular CUSUM is used without any
head start. Are there any points that are out of control? The Shewhart control chart to be used is the
moving range chart.
AI-Generated Solution

Unlock instant AI solutions
Tap the button
to generate a solution
Recommended textbooks for you
Mathematics For Machine Technology
Advanced Math
ISBN:
9781337798310
Author:
Peterson, John.
Publisher:
Cengage Learning,

Glencoe Algebra 1, Student Edition, 9780079039897…
Algebra
ISBN:
9780079039897
Author:
Carter
Publisher:
McGraw Hill
Mathematics For Machine Technology
Advanced Math
ISBN:
9781337798310
Author:
Peterson, John.
Publisher:
Cengage Learning,
Glencoe Algebra 1, Student Edition, 9780079039897…
Algebra
ISBN:
9780079039897
Author:
Carter
Publisher:
McGraw Hill