The data in the table below represent the number of hours of pain relief provided by 5 different brands of headache tablets administered to 25 subjects, who were randomly divided into 5 groups, and each group was treated to a different brand. Tablet A B C D E 5 3 2 7 4 5 3 6 8 2 4 9 6 3 1 4 3 7 4 7 Total 26 39 20 14 33 132 Mean 5.2 7.8 2.8 6.6 5.28 Perform the analysis of variance, and test the hypothesis at the 0.05 level of significance that the mean number of hours of relief provided by the tablets is the same for all 5 brands. 9 7 8 6 9
The data in the table below represent the number of hours of pain relief provided by 5 different brands of headache tablets administered to 25 subjects, who were randomly divided into 5 groups, and each group was treated to a different brand. Tablet A B C D E 5 3 2 7 4 5 3 6 8 2 4 9 6 3 1 4 3 7 4 7 Total 26 39 20 14 33 132 Mean 5.2 7.8 2.8 6.6 5.28 Perform the analysis of variance, and test the hypothesis at the 0.05 level of significance that the mean number of hours of relief provided by the tablets is the same for all 5 brands. 9 7 8 6 9

MATLAB: An Introduction with Applications
6th Edition
ISBN:9781119256830
Author:Amos Gilat
Publisher:Amos Gilat
Chapter1: Starting With Matlab
Section: Chapter Questions
Problem 1P

Related questions
Question
Please help me. Our topic is One-Way Analysis of Variance.
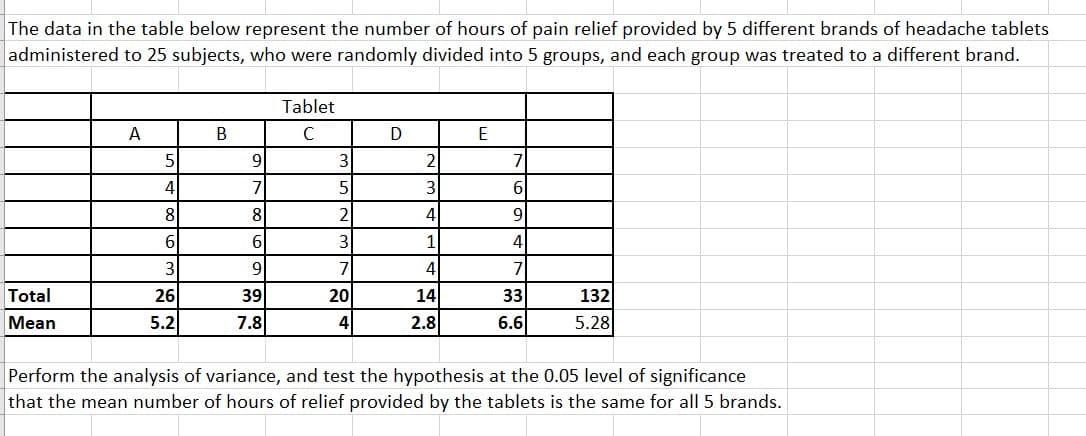
Transcribed Image Text:The data in the table below represent the number of hours of pain relief provided by 5 different brands of headache tablets
administered to 25 subjects, who were randomly divided into 5 groups, and each group was treated to a different brand.
Tablet
A
B
с
D
E
5
31
2
7
4
5
3
6
8
2
4
9
6
3
1
4
3
7
4
7
Total
26
39
20
14
33
132
Mean
5.2
7.8
4
2.8
6.6
5.28
Perform the analysis of variance, and test the hypothesis at the 0.05 level of significance
that the mean number of hours of relief provided by the tablets is the same for all 5 brands.
9
7
8
6
9
Expert Solution
This question has been solved!
Explore an expertly crafted, step-by-step solution for a thorough understanding of key concepts.

Step by step
Solved in 2 steps with 2 images

Recommended textbooks for you
MATLAB: An Introduction with Applications
Statistics
ISBN:
9781119256830
Author:
Amos Gilat
Publisher:
John Wiley & Sons Inc

Probability and Statistics for Engineering and th…
Statistics
ISBN:
9781305251809
Author:
Jay L. Devore
Publisher:
Cengage Learning

Statistics for The Behavioral Sciences (MindTap C…
Statistics
ISBN:
9781305504912
Author:
Frederick J Gravetter, Larry B. Wallnau
Publisher:
Cengage Learning
MATLAB: An Introduction with Applications
Statistics
ISBN:
9781119256830
Author:
Amos Gilat
Publisher:
John Wiley & Sons Inc
Probability and Statistics for Engineering and th…
Statistics
ISBN:
9781305251809
Author:
Jay L. Devore
Publisher:
Cengage Learning
Statistics for The Behavioral Sciences (MindTap C…
Statistics
ISBN:
9781305504912
Author:
Frederick J Gravetter, Larry B. Wallnau
Publisher:
Cengage Learning

Elementary Statistics: Picturing the World (7th E…
Statistics
ISBN:
9780134683416
Author:
Ron Larson, Betsy Farber
Publisher:
PEARSON

The Basic Practice of Statistics
Statistics
ISBN:
9781319042578
Author:
David S. Moore, William I. Notz, Michael A. Fligner
Publisher:
W. H. Freeman

Introduction to the Practice of Statistics
Statistics
ISBN:
9781319013387
Author:
David S. Moore, George P. McCabe, Bruce A. Craig
Publisher:
W. H. Freeman