The data show the chest size and weight of several bears. Find the regression equation, letting chest size be the independent (x) variable. Then find the best predicted weight of a bear with a chest size of 48 inches. Is the result close to the actual weight of 218 pounds? Use a significance level of 0.05. Chest size (inches) Weight (pounds) E Click the icon to view the critical values of the Pearson correlation coefficient r. 58 49 58 43 46 57 355 266 332 177 246 348 What is the regression equation?
The data show the chest size and weight of several bears. Find the regression equation, letting chest size be the independent (x) variable. Then find the best predicted weight of a bear with a chest size of 48 inches. Is the result close to the actual weight of 218 pounds? Use a significance level of 0.05. Chest size (inches) Weight (pounds) E Click the icon to view the critical values of the Pearson correlation coefficient r. 58 49 58 43 46 57 355 266 332 177 246 348 What is the regression equation?

MATLAB: An Introduction with Applications
6th Edition
ISBN:9781119256830
Author:Amos Gilat
Publisher:Amos Gilat
Chapter1: Starting With Matlab
Section: Chapter Questions
Problem 1P

Related questions
Question
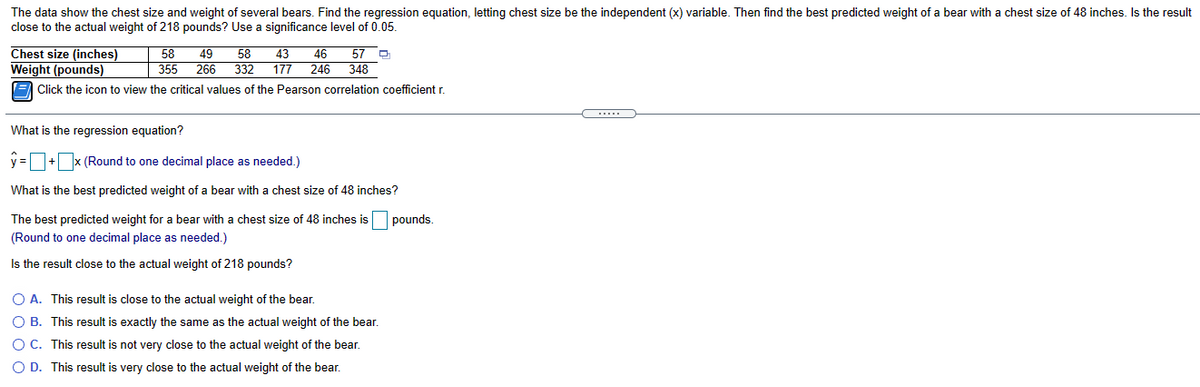
Transcribed Image Text:The data show the chest size and weight of several bears. Find the regression equation, letting chest size be the independent (x) variable. Then find the best predicted weight of a bear with a chest size of 48 inches. Is the result
close to the actual weight of 218 pounds? Use a significance level of 0.05.
Chest size (inches)
Weight (pounds)
(= Click the icon to view the critical values of the Pearson correlation coefficient r.
49
355
266
58
58
57
46
348
43
332
177
246
What is the regression equation?
y =+x (Round to one decimal place as needed.)
What is the best predicted weight of a bear with a chest size of 48 inches?
The best predicted weight for a bear with a chest size of 48 inches is
pounds.
(Round to one decimal place as needed.)
Is the result close to the actual weight of 218 pounds?
O A. This result is close to the actual weight of the bear.
O B. This result is exactly the same as the actual weight of the bear.
O C. This result is not very close to the actual weight of the bear.
O D. This result is very close to the actual weight of the bear.
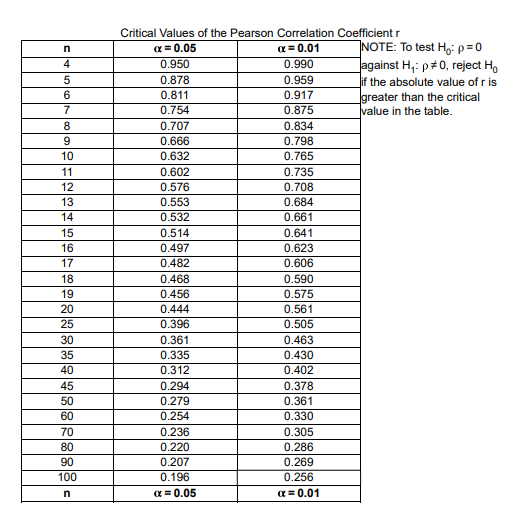
Transcribed Image Text:Critical Values of the Pearson Correlation Coefficient r
NOTE: To test H,: p=0
Jagainst H,: p#0, reject H,
if the absolute value of r is
Igreater than the critical
value in the table.
a = 0.05
a = 0.01
4
0.950
0.990
0.878
0.959
0.811
0.917
7
0.754
0.875
8
0.707
0.834
0.666
0.798
10
0.632
0.765
11
0.602
0.735
12
0.576
0.708
13
0.553
0.684
14
0.532
0.661
15
0.514
0.641
16
0.497
0.623
0.606
17
0.482
18
0.468
0.590
19
0.456
0.575
20
0.444
0.561
25
0.396
0.505
30
0.361
0.463
35
0.335
0.430
40
0.312
0.402
45
0.294
0.378
50
0.279
0.361
60
0.254
0.330
70
0.236
0.305
80
0.220
0.286
90
0.207
0.269
100
0.196
0.256
a = 0.05
a = 0.01
Expert Solution
This question has been solved!
Explore an expertly crafted, step-by-step solution for a thorough understanding of key concepts.

Step by step
Solved in 2 steps with 2 images

Recommended textbooks for you
MATLAB: An Introduction with Applications
Statistics
ISBN:
9781119256830
Author:
Amos Gilat
Publisher:
John Wiley & Sons Inc

Probability and Statistics for Engineering and th…
Statistics
ISBN:
9781305251809
Author:
Jay L. Devore
Publisher:
Cengage Learning

Statistics for The Behavioral Sciences (MindTap C…
Statistics
ISBN:
9781305504912
Author:
Frederick J Gravetter, Larry B. Wallnau
Publisher:
Cengage Learning
MATLAB: An Introduction with Applications
Statistics
ISBN:
9781119256830
Author:
Amos Gilat
Publisher:
John Wiley & Sons Inc
Probability and Statistics for Engineering and th…
Statistics
ISBN:
9781305251809
Author:
Jay L. Devore
Publisher:
Cengage Learning
Statistics for The Behavioral Sciences (MindTap C…
Statistics
ISBN:
9781305504912
Author:
Frederick J Gravetter, Larry B. Wallnau
Publisher:
Cengage Learning

Elementary Statistics: Picturing the World (7th E…
Statistics
ISBN:
9780134683416
Author:
Ron Larson, Betsy Farber
Publisher:
PEARSON

The Basic Practice of Statistics
Statistics
ISBN:
9781319042578
Author:
David S. Moore, William I. Notz, Michael A. Fligner
Publisher:
W. H. Freeman

Introduction to the Practice of Statistics
Statistics
ISBN:
9781319013387
Author:
David S. Moore, George P. McCabe, Bruce A. Craig
Publisher:
W. H. Freeman