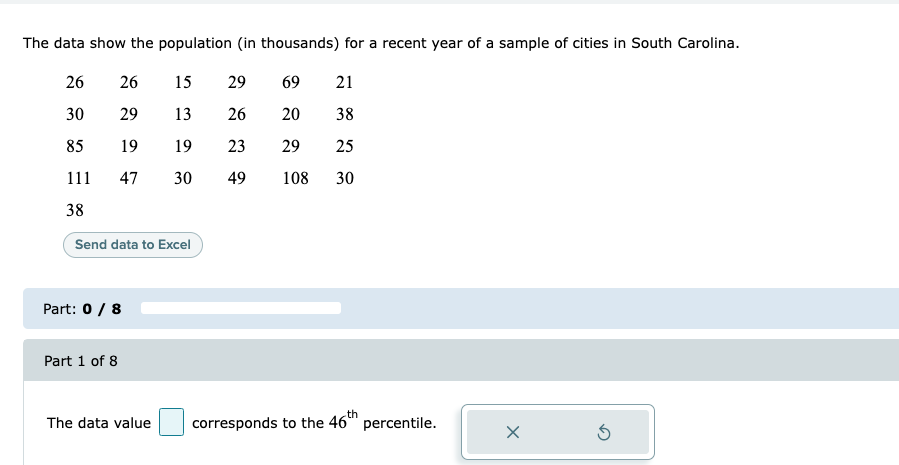
The data show the population (in thousands) for a recent year of a sample of cities in South Carolina. 26 15 29 69 30 29 13 26 20 38 85 19 19 23 29 25 111 47 30 49 108 30 38 Send data to Excel Part: 0 / 8 Part 1 of 8 th The data value corresponds to the 46" percentile. 21 26
Q: A single serving bag of Ray's Classic Potato Chips is listed on the package to be 28.3 grams. The ma...
A:
Q: In a 2020 AAA Poll, 1,033 randomly selected American adults were asked whether they would prefer sel...
A:
Q: In a psychology journal, researchers reported that a chief executive offlicer's facial structure can...
A: Find 99 % confidence interval
Q: llustration 16.32. Five cards are drawn from a pack. What is the probability of three being 4 kings....
A:
Q: 14% of all Americans suffer from sleep apnea. A researcher suspects that a lower percentage of those...
A: Here is given that, population proportion is 0.14 And sample number is 341 and 34 selected from 341....
Q: A political candidate testing the effectiveness of a new advertisement takes a simple random sample ...
A:
Q: For the past several years, 55% of students at a particular college who lived on campus one year cho...
A: The one sample z test is conducted for a proportion of college students who plan to live on campus a...
Q: A classification tree is built on the data below to predict whether or not a student will pass a cou...
A:
Q: Let's say we are trying to figure out what time the doors should open for a concert. Pretend that ar...
A: Given: 20 minutes Early 5 minutes Late uniformly distributed
Q: SlackBoard, a company pro need to run additional servers due to increased use of its LMS. SlackBoard...
A: Given that Sample size n =64 Sample mean =91 Standard deviation =64
Q: For a within-subjects study comparing two treatments, A and B, a researcher expects that practice in...
A: The answer is influence scores in treatment A for half the participants and scores in treatment B fo...
Q: Determine whether the following is a probability distribution. If not, identify the requirement that...
A:
Q: Leading up to this past November’s election, suppose that two polls of randomly selected registered ...
A: Given that Sample sizes n1=140 , n2=100 Favorable cases x1=98 , n2=80 NOTE:- According to bartleby ...
Q: The college president asks the statistics teacher to estimate the average age of the students at the...
A:
Q: Two samples, each with n = 9 scores, produce an independent-measures t statistic of t = +4.00. What ...
A: It is given that the test statistic value is 4.
Q: Let's say you are about to play a new game at a casino. The way the game works is that you flip an u...
A: Given: x = number of headsp = probability that the coin is head = 0.7n = number of trials = 2
Q: 2. Which of the following is not considered a personal risk? a. Insufficient income during retiremen...
A: 2. Personal risk can impact individual or family.
Q: lease see below. Note that I am only given one attempt at this and I believe that the answer I have ...
A: Solution: For sample size determination in case of proportion if we dont have knowledge about appr...
Q: Assuming all other factors are held constant, if the df value for a two-tailed t-test with a = .05 w...
A: Given that α=5%=0.05 , df=8 Degree of freedom (df) is increased to 25
Q: In a sample of 8 hip surgeries, the average surgery times was 131.5 minutes with a standard deviatio...
A: We know that, the best point estimate of population mean is nothing but sample mean which is obtaine...
Q: Identify the distributions of the random variables with the following moment-generating functions: а...
A: Given: a. m(t)=(1-4t)^(-2) b. m(t)=1/(1-3.2t) c. m(t)=e^(-5t+6t^2)
Q: Refer to Exercise 3.145. Use the uniqueness of moment-generating functions to give the dis- tributio...
A:
Q: A town has two fire trucks operating independently. The probability that a truck is available, when ...
A: Let p denote the probability that a trick is available. Given that p = 0.906 Let X denote the number...
Q: Construct a 95% confidence interval for the average cable bill of all American household
A:
Q: In the year 2000, the average car had a fuel economy of 22.74 MPG. You are curious as to whether thi...
A: Given that Population mean μ =22.74 Level of significance =0.05 P-value =0.6901
Q: A sample of birth weights of 13 girls was taken. Below are the results (in g): 2961.8 3509.5 2808.6 ...
A: From the given data fill all the required blanks
Q: 1. Briefly explain why statistics are needed.
A: We know, General meaning of stastics * Science of learning from data. First (decision of reserch ...
Q: Opo 8:33 PM Allowed po ba yung gantong question? Using the data below and the step...
A: Introduction: Frequency Distribution: A frequency distribution is the tabular representation of th...
Q: For a large, top-rated corporation, 91% of employees said the corporation is a great place to work. ...
A:
Q: Arandom sample of n measurements was selected from a population with unknown mean p and standard dev...
A:
Q: Value of x -2 1 2 10 P(X = x) 0.15 0.20 0.11 0.19 0.22 0.13 Calculate the probability of randomly se...
A:
Q: calculate the mean score of the students identify the modal score identify the median score
A: Note: According to Bartleby expert guidelines, we can answer only first question with their three su...
Q: The bottom panel of figure 1 (p. 311) shows the probability histogram for the total number of spots ...
A: Here probability histogram given Area under the histogram =? 1 - chance that the total no. Of spots...
Q: 9.4.4 At a Midwestern hospital there were a total of 932 births in 20 consecutive weeks. Of these bi...
A: Given Total number of birth=932 Number of birth occured on weekends=216 p-value=0.0003 α=0.05 Find V...
Q: Suppose that a random sample of 75 Republicans had a mean income of $60,000 with a standard deviatio...
A:
Q: 3. Operators of gasoline-fueled vehicles complain about the price of gasoline in gas stations. The C...
A: The random variable gas tax follows normal distribution. We have to test whether the average per gal...
Q: i. the value of the constant C. ii. the marginal probability density functions of fx(x) of X and fy(...
A:
Q: A voter who has a weight that is greater than or equal to the quota is called a dictator. In a weigh...
A:
Q: Given that the 95% confidence interval estimate of the proportion of water specimens that contain de...
A: Given 95% CI for population proportion (p) (0.529,0.627)
Q: Please see below. Note that I am only given one attempt at this. Please help!! (A) A random sample ...
A:
Q: Determine the mean and the ontinuous) random variables with the following moment-generatir M(t) = (1...
A: The moment generating function is M(t)=(1-4t)-2
Q: What does a Model mean? Discuss FIVE characteristics of a Model.
A:
Q: Test the claim below about the mean of the differences for a population of paired data at the level ...
A:
Q: An individual in the market for a new cell phone was interested in the proportion of the U.S. popula...
A: The random variable use an iPhone follows normal distribution. We have to interpret the 95% confiden...
Q: 7. Find the moment generating function of standard binomial variate -np and show that it tends to Vn...
A:
Q: Using samples of 200 credit card statements, an auditor found the following: Sample Number with erro...
A: Since you posted a question with multiple subparts, we will solve first three subparts for you. To g...
Q: Question 15 Both of the graphs presented below represent Normal distributions with a mean of u = 10....
A: Given that From the Given graph
Q: Find the moment generating function, mean and variance of X if the probability mass function is f(x)...
A: Let X be a random variable with probability function (probability mass function or probability densi...
Q: In testing Ho: P 0.5 against H3: P> 0.5, 400 voters were surveyed and 216 reported they were in favo...
A: From the provided information, Sample size (n) = 400 From which 216 reported they were in favor of t...
Q: Which of the following methods helps reduce sampling bias? O a. Take a random sample from a populati...
A: It is needed to find the method that reduces sampling bias.
Trending now
This is a popular solution!
Step by step
Solved in 2 steps with 2 images
- A researcher collects data that represents the average number of hours of sleep in the last two nights by 8 depressed patients and 9 non-depressed patients. The researcher is interested in whether the two groups reliably differ in the amount of sleep they get. Use Jamovi to calculate t-obt and the p value.The given paired data lists the heights (in inches) of various males who were measured on their eighth and sixteenth birthdays. Height (8 yrs) 52 50 48 51 51 48 (x) Height (16 yrs) 69 66 64 67 69 65 (y) Determine the residual value for an x of 48 and explain its meaning.A sample of average high temperature during July (x) of cities in Colorado compared to their elevation in feet (y) yields the following results: x 90 75 85 94 89 94 78 76 88 y 5280 9494 6035 4078 6191 4583 8000 8022 5807 Find y2
- The data corresponds to a study that found that the number of stumps from trees felled by beavers predicts the abundance of beetle larvae. Stumps Beetle larvae 2 10 2 30 1 12 3 24 3 36 4 40 3 43 1 11 2 27 5 56 1 18 3 40 2 25 1 8 2 21 2 14 1 16 1 6 4 54 1 9 2 13 1 14 4 50 Click to download the data in your preferred format. CSV Excel JMP Mac-Text Minitab14-18 Minitab18+ PC-Text R SPSS TI CrunchIt! Is there good evidence that more beetle larvae clusters are present when beavers have left more tree stumps? Estimate how many more clusters accompany each additional stump, with 95% confidence. SOLVE: Use the software of your choice to make a scatterplot of the data. There is a positive non‑linear relationship. There is a negative non‑linear relationship. There is a positive linear relationship. There is a negative linear relationship. Calculate the intercept ? , and…A study of the relationship between age and various visual functions (such as acuity and depth perception) reported the following observations on the area of scleral lamina (mm2) from human optic nerve heads: 2.84 2.63 2.76 3.75 2.28 2.64 3.94 4.11 3.80 4.27 3.49 4.51 2.40 3.59 2.72 3.55 3.02 (a) Calculate Σxi and Σxi2. Σxi = ? mm2 Σxi2 = ? mm4 (b) Use the values calculated in part (a) to compute the sample variance s2 and then the sample standard deviation s. (Round your answers to four decimal places.) s2 = ? mm4 s = ? mm2Find the z-score corresponding to a score of X = 45 μ = 40 and σ = 20 μ = 40 and σ =10 μ = 40 and σ = 5 μ = 40 and σ = 2