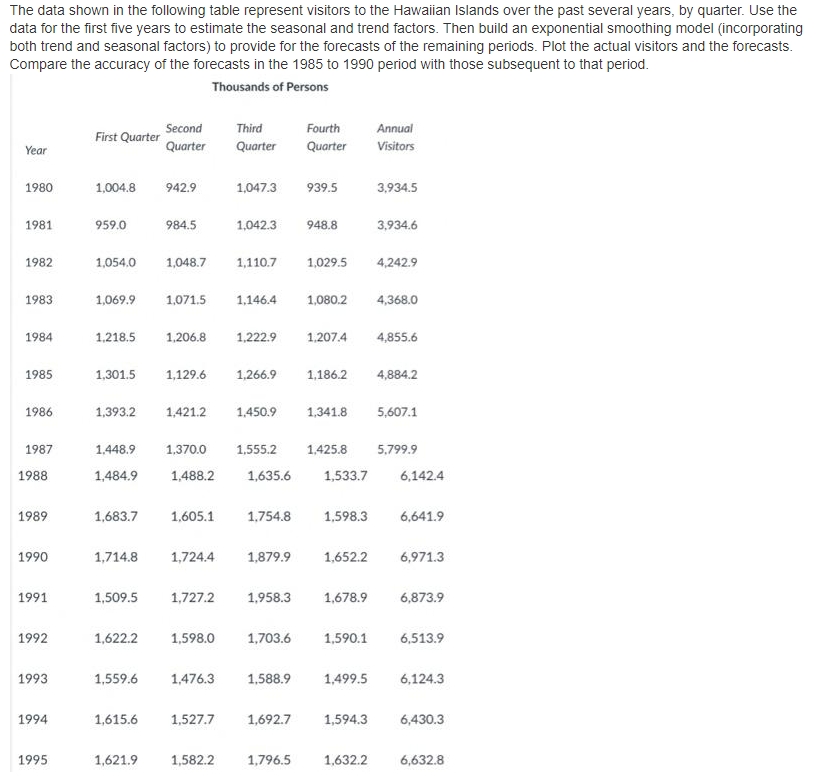
The data shown in the following table represent visitors to the Hawaiian Islands over the past several years, by quarter. Use the data for the first five years to estimate the seasonal and trend factors. Then build an exponential smoothing model (incorporating both trend and seasonal factors) to provide for the forecasts of the remaining periods. Plot the actual visitors and the forecasts. Compare the accuracy of the forecasts in the 1985 to 1990 period with those subsequent to that period.
The data shown in the following table represent visitors to the Hawaiian Islands over the past several years, by quarter. Use the data for the first five years to estimate the seasonal and trend factors. Then build an exponential smoothing model (incorporating both trend and seasonal factors) to provide for the forecasts of the remaining periods. Plot the actual visitors and the forecasts. Compare the accuracy of the forecasts in the 1985 to 1990 period with those subsequent to that period.

Practical Management Science
6th Edition
ISBN:9781337406659
Author:WINSTON, Wayne L.
Publisher:WINSTON, Wayne L.
Chapter13: Regression And Forecasting Models
Section13.7: Exponential Smoothing Models
Problem 28P: The file P13_28.xlsx contains monthly retail sales of U.S. liquor stores. a. Is seasonality present...

Related questions
Question
Transcribed Image Text:The data shown in the following table represent visitors to the Hawaiian Islands over the past several years, by quarter. Use the
data for the first five years to estimate the seasonal and trend factors. Then build an exponential smoothing model (incorporating
both trend and seasonal factors) to provide for the forecasts of the remaining periods. Plot the actual visitors and the forecasts.
Compare the accuracy of the forecasts in the 1985 to 1990 period with those subsequent to that period.
Thousands of Persons
Second
Third
Fourth
Annual
First Quarter
Year
Quarter
Quarter
Quarter
Visitors
1980
1,004.8
942.9
1,047.3
939.5
3,934.5
1981
959.0
984.5
1,042.3
948.8
3,934.6
1982
1,054.0
1,048.7
1,110.7
1,029.5
4,242.9
1983
1,069.9
1,071.5
1,146.4
1,080.2
4,368.0
1984
1,218.5
1,206.8
1,222.9
1,207.4
4,855.6
1985
1,301.5
1,129.6
1,266.9
1,186.2
4,884.2
1986
1,393.2
1,421.2
1,450.9
1,341.8
5,607.1
1987
1,448.9
1,370.0
1,555.2
1,425.8
5,799.9
1988
1,484.9
1,488.2
1,635.6
1,533.7
6,142.4
1989
1,683.7
1,605.1
1,754.8
1,598.3
6,641.9
1990
1,714.8
1,724.4
1,879.9
1,652.2
6,971.3
1991
1,509.5
1,727.2
1,958.3
1,678.9
6,873.9
1992
1,622.2
1,598.0
1,703.6
1,590.1
6,513.9
1993
1,559.6
1,476.3
1,588.9
1,499.5
6,124.3
1994
1,615.6
1,527.7
1,692.7
1,594.3
6,430.3
1995
1,621.9
1,582.2
1,796.5
1,632.2
6,632.8
Expert Solution
This question has been solved!
Explore an expertly crafted, step-by-step solution for a thorough understanding of key concepts.

Step by step
Solved in 6 steps with 7 images

Recommended textbooks for you
Practical Management Science
Operations Management
ISBN:
9781337406659
Author:
WINSTON, Wayne L.
Publisher:
Cengage,

Contemporary Marketing
Marketing
ISBN:
9780357033777
Author:
Louis E. Boone, David L. Kurtz
Publisher:
Cengage Learning

Marketing
Marketing
ISBN:
9780357033791
Author:
Pride, William M
Publisher:
South Western Educational Publishing
Practical Management Science
Operations Management
ISBN:
9781337406659
Author:
WINSTON, Wayne L.
Publisher:
Cengage,
Contemporary Marketing
Marketing
ISBN:
9780357033777
Author:
Louis E. Boone, David L. Kurtz
Publisher:
Cengage Learning
Marketing
Marketing
ISBN:
9780357033791
Author:
Pride, William M
Publisher:
South Western Educational Publishing