The data shown to the right are from independent simple random samples from three populations. Use these data to complete parts (a) through (d). Sample Sample 2 Samp Click the icon to view a table of values of Fa 3 2 6 14 a. Compute SST, SSTR, and SSE using the following computing formulas, where x, is the ith observation, n is the total number of observations, n, is the sample size for population j, and T, is the sum of the sample data from population SST Σ- (Σ)"In SSTR - Σ (τ? In) - (Σ )/n and SSE - SST - SSTR Compute the values required to find SST, SSTR, and SSE. n= Ex = (Type integers or decimals. Do not round.) Calculate SST, SSTR, and SSE using the computing formulas. SST = (Type an integer or a decimal. Do not round.) (Type an integer or a decimal. Do not round.) (Type an integer or a decimal. Do not round.) STR= SSE = b. Compare your results in part (a) for SSTR and SE with the following results from the defining formulas. SSTR = En (-x)² =| and SSE = E(n - 1)s² = When the value of SSTR is found by using the defining formula, it value as when it is found by using the computing formula. the same value as when it is found by using the computing formula. When the value of SSE is found by using the defining formula, it th c. Construct a one-way ANOVA table. Source Treatment F-statistic df MS Error Total (Type integers or decimals rounded to two decimal places as needed.) d. Decide, at the 5% significance level, whether the data provide sufficient evidence to conclude that the means of the populations from which the samples were drawn are not all the same. First, let u,, P2, and pa be the population means of samples 1, 2, and 3, respectively. What are the correct hypotheses for a one-way ANOVA test? OA. Ho: H =H2 = P3 H: Not all the means are equal. O B. H,: H =H2 =P3 OC. Ho: H, #H2 #H3 H: All the means are equal. OD. Ho: H #H2#H3 H, H =2 =H3 Now determine the critical value F F= (Round to two decimal places as needed.) Finally, what is the correct conclusion? Since the F-statistic in the rejection region, Ho. The data sufficient evidence to conclude that the population means are not all the same.
The data shown to the right are from independent simple random samples from three populations. Use these data to complete parts (a) through (d). Sample Sample 2 Samp Click the icon to view a table of values of Fa 3 2 6 14 a. Compute SST, SSTR, and SSE using the following computing formulas, where x, is the ith observation, n is the total number of observations, n, is the sample size for population j, and T, is the sum of the sample data from population SST Σ- (Σ)"In SSTR - Σ (τ? In) - (Σ )/n and SSE - SST - SSTR Compute the values required to find SST, SSTR, and SSE. n= Ex = (Type integers or decimals. Do not round.) Calculate SST, SSTR, and SSE using the computing formulas. SST = (Type an integer or a decimal. Do not round.) (Type an integer or a decimal. Do not round.) (Type an integer or a decimal. Do not round.) STR= SSE = b. Compare your results in part (a) for SSTR and SE with the following results from the defining formulas. SSTR = En (-x)² =| and SSE = E(n - 1)s² = When the value of SSTR is found by using the defining formula, it value as when it is found by using the computing formula. the same value as when it is found by using the computing formula. When the value of SSE is found by using the defining formula, it th c. Construct a one-way ANOVA table. Source Treatment F-statistic df MS Error Total (Type integers or decimals rounded to two decimal places as needed.) d. Decide, at the 5% significance level, whether the data provide sufficient evidence to conclude that the means of the populations from which the samples were drawn are not all the same. First, let u,, P2, and pa be the population means of samples 1, 2, and 3, respectively. What are the correct hypotheses for a one-way ANOVA test? OA. Ho: H =H2 = P3 H: Not all the means are equal. O B. H,: H =H2 =P3 OC. Ho: H, #H2 #H3 H: All the means are equal. OD. Ho: H #H2#H3 H, H =2 =H3 Now determine the critical value F F= (Round to two decimal places as needed.) Finally, what is the correct conclusion? Since the F-statistic in the rejection region, Ho. The data sufficient evidence to conclude that the population means are not all the same.

Algebra & Trigonometry with Analytic Geometry
13th Edition
ISBN:9781133382119
Author:Swokowski
Publisher:Swokowski
Chapter10: Sequences, Series, And Probability
Section10.8: Probability
Problem 38E

Related questions

Topic Video
Question
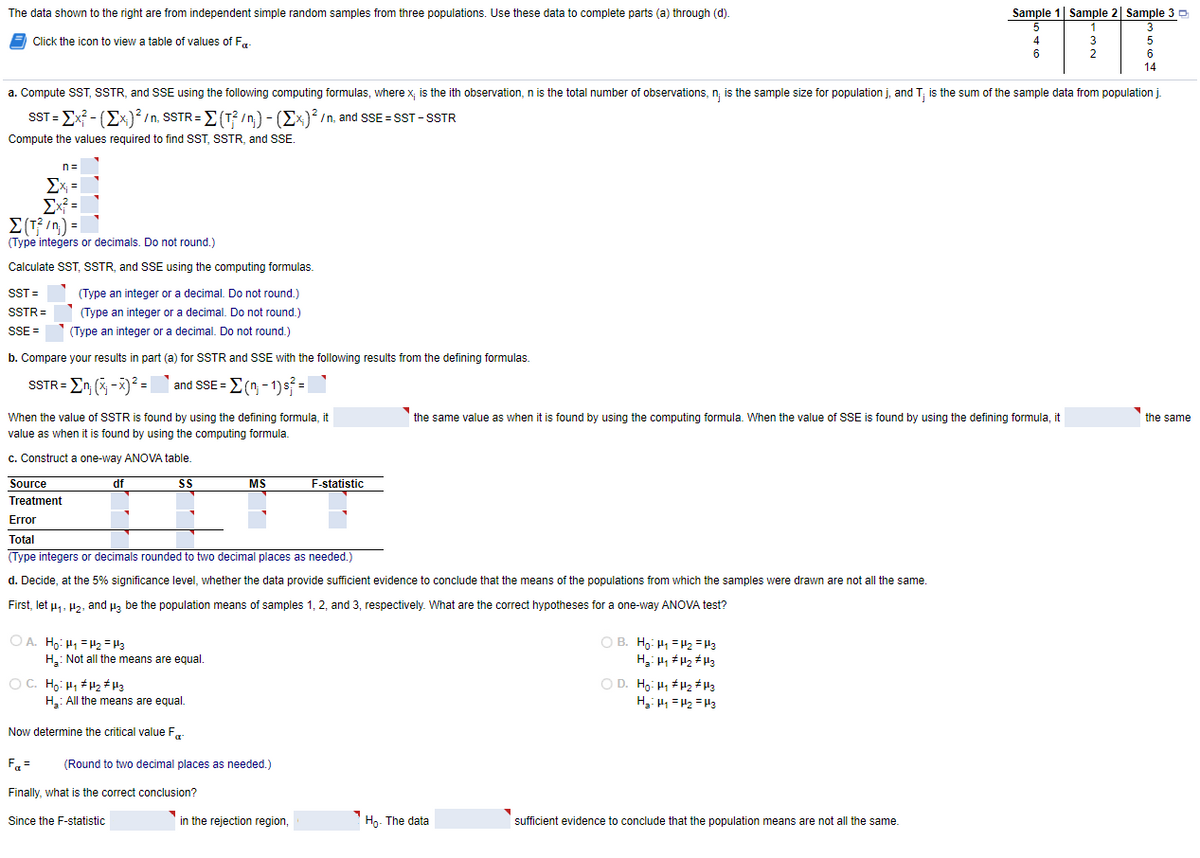
Transcribed Image Text:The data shown to the right are from independent simple random samples from three populations. Use these data to complete parts (a) through (d).
Sample 1| Sample 2| Sample 30
E
Click the icon to view a table of values of Fa-
4
5
2
6
14
a. Compute ST, SSTR, and SE using the following computing formulas, where x, is the ith observation, n is the total number of observations, n; is the sample size for population j, and T; is the sum of the sample data from population j.
SST = Ex? - (Ex)? /n, SSTR= E(T? /n) - (Ex)? /n, and SSE = SST-SSTR
Compute the values required to find SST, SSTR, and SSE.
n=
Ex =
Ex =
E(T; /n) =
(Type integers or decimals. Do not round.)
Calculate SST, SSTR, and SSE using the computing formulas.
SST =
(Type an integer or a decimal. Do not round.)
SSTR=
(Type an integer or a decimal. Do not round.)
SSE =
(Type an integer or a decimal. Do not round.)
b. Compare your results in part (a) for SSTR and SSE with the following results from the defining formulas.
SSTR = En (x -X)² = and SSE = E ( - 1)s =
When the value of SSTR is found by using the defining formula, it
the same value as when it is found by using the computing formula. When the value of SSE is found by using the defining formula it
the same
value as when it is found by using the computing formula.
c. Construct a one-way ANOVA table.
Source
df
SS
MS
F-statistic
Treatment
Error
Total
(Type integers or decimals rounded to two decimal places as needed.)
d. Decide, at the 5% significance level, whether the data provide sufficient evidence to conclude that the means of the populations from which the samples were drawn are not all the same.
First, let u,, H2, and µa be the population means of samples 1, 2, and 3, respectively. What are the correct hypotheses for a one-way ANOVA test?
O A. Ho: H =H2 = H3
H.: Not all the means are equal.
O B. Ho: H1 =H2 = H3
O C. Ho: H1 H2 # H3
H: All the means are equal.
O D. H,: H1 H2 # H3
H, H1 = H2 =H3
Now determine the critical value F
Fa =
(Round to two decimal places as needed.)
Finally, what is the correct conclusion?
Since the F-statistic
in the rejection region,
Hg- The data
sufficient evidence to conclude that the population means are not all the same.
Expert Solution
This question has been solved!
Explore an expertly crafted, step-by-step solution for a thorough understanding of key concepts.

This is a popular solution!

Trending now
This is a popular solution!

Step by step
Solved in 3 steps

Knowledge Booster


Learn more about
Need a deep-dive on the concept behind this application? Look no further. Learn more about this topic, statistics and related others by exploring similar questions and additional content below.Recommended textbooks for you
Algebra & Trigonometry with Analytic Geometry
Algebra
ISBN:
9781133382119
Author:
Swokowski
Publisher:
Cengage
Algebra & Trigonometry with Analytic Geometry
Algebra
ISBN:
9781133382119
Author:
Swokowski
Publisher:
Cengage