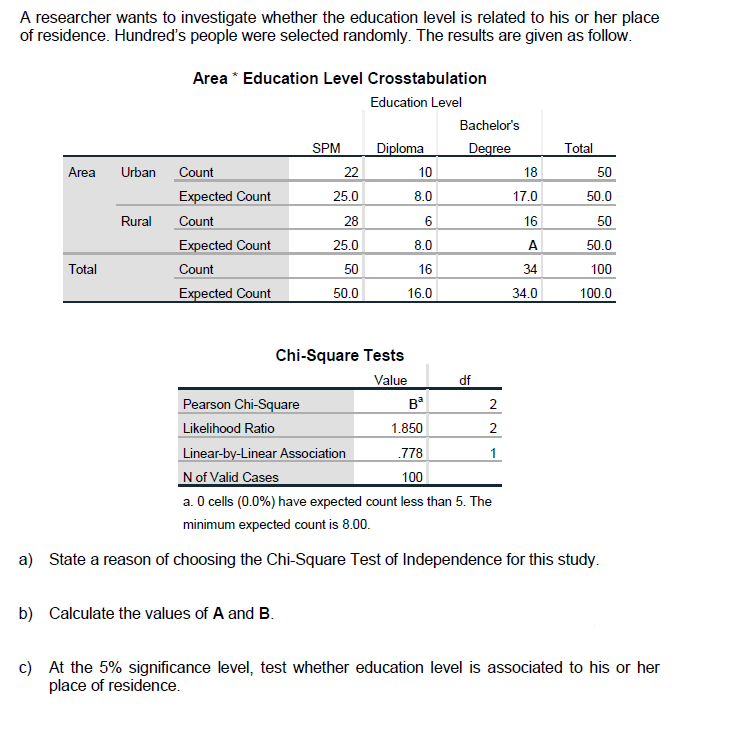
A researcher wants to investigate whether the education level is related to his or her place of residence. Hundred's people were selected randomly. The results are given as follow. Area * Education Level Crosstabulation Education Level Bachelor's SPM Diploma Degree Total Area Urban Count 22 10 18 50 Expected Count 25.0 8.0 17.0 50.0 Rural Count 28 16 50 Expected Count 25.0 8.0 A 50.0 Total Count 50 16 34 100 Expected Count 50.0 16.0 34.0 100.0 Chi-Square Tests Value B df Pearson Chi-Square 2 Likelihood Ratio 1.850 2 Linear-by-Linear Association .778 1 Nof Valid Cases 100 a. O cells (0.0%) have expected count less than 5. The minimum expected count is 8.00. a) State a reason of choosing the Chi-Square Test of Independence for this study. b) Calculate the values of A and B. c) At the 5% significance level, test whether education level is associated to his or her place of residence.
A researcher wants to investigate whether the education level is related to his or her place of residence. Hundred's people were selected randomly. The results are given as follow. Area * Education Level Crosstabulation Education Level Bachelor's SPM Diploma Degree Total Area Urban Count 22 10 18 50 Expected Count 25.0 8.0 17.0 50.0 Rural Count 28 16 50 Expected Count 25.0 8.0 A 50.0 Total Count 50 16 34 100 Expected Count 50.0 16.0 34.0 100.0 Chi-Square Tests Value B df Pearson Chi-Square 2 Likelihood Ratio 1.850 2 Linear-by-Linear Association .778 1 Nof Valid Cases 100 a. O cells (0.0%) have expected count less than 5. The minimum expected count is 8.00. a) State a reason of choosing the Chi-Square Test of Independence for this study. b) Calculate the values of A and B. c) At the 5% significance level, test whether education level is associated to his or her place of residence.

Holt Mcdougal Larson Pre-algebra: Student Edition 2012
1st Edition
ISBN:9780547587776
Author:HOLT MCDOUGAL
Publisher:HOLT MCDOUGAL
Chapter11: Data Analysis And Probability
Section11.4: Collecting Data
Problem 6E

Related questions
Question
Transcribed Image Text:A researcher wants to investigate whether the education level is related to his or her place
of residence. Hundred's people were selected randomly. The results are given as follow.
Area * Education Level Crosstabulation
Education Level
Bachelor's
SPM
Diploma
Degree
Total
Area
Urban
Count
22
10
18
50
Expected Count
25.0
8.0
17.0
50.0
Rural
Count
28
16
50
Expected Count
25.0
8.0
A
50.0
Total
Count
50
16
34
100
Expected Count
50.0
16.0
34.0
100.0
Chi-Square Tests
Value
df
Pearson Chi-Square
в
2
Likelihood Ratio
1.850
2
Linear-by-Linear Association
.778
1
N of Valid Cases
a. O cells (0.0%) have expected count less than 5. The
100
minimum expected count is 8.00.
a) State a reason of choosing the Chi-Square Test of Independence for this study.
b) Calculate the values of A and B.
c) At the 5% significance level, test whether education level is associated to his or her
place of residence.
Expert Solution
This question has been solved!
Explore an expertly crafted, step-by-step solution for a thorough understanding of key concepts.

Step by step
Solved in 2 steps

Recommended textbooks for you
Holt Mcdougal Larson Pre-algebra: Student Edition…
Algebra
ISBN:
9780547587776
Author:
HOLT MCDOUGAL
Publisher:
HOLT MCDOUGAL

Glencoe Algebra 1, Student Edition, 9780079039897…
Algebra
ISBN:
9780079039897
Author:
Carter
Publisher:
McGraw Hill

College Algebra (MindTap Course List)
Algebra
ISBN:
9781305652231
Author:
R. David Gustafson, Jeff Hughes
Publisher:
Cengage Learning
Holt Mcdougal Larson Pre-algebra: Student Edition…
Algebra
ISBN:
9780547587776
Author:
HOLT MCDOUGAL
Publisher:
HOLT MCDOUGAL
Glencoe Algebra 1, Student Edition, 9780079039897…
Algebra
ISBN:
9780079039897
Author:
Carter
Publisher:
McGraw Hill
College Algebra (MindTap Course List)
Algebra
ISBN:
9781305652231
Author:
R. David Gustafson, Jeff Hughes
Publisher:
Cengage Learning
