The data table contains waiting times of customers at a bank, where customers enter a single waiting line that feeds three teller windows. Test the claim that the standard deviation of waiting times is less than 2.3 minutes, which is the standard deviation of waiting times at the same bank when separate waiting lines are used at each teller window. Use a significance level of 0.025. Complete parts (a) through (d) below. E Click on the icon to view the data. O A. Họ: a=2.3 minutes HA a<23 minutes OB. H: a<2.3 minutes HA: a=2.3 minutes OD. H: 0223 minutes OC. Họ: 0=23 minutes HA a2.3 minutes HA: a<2.3 minutes b. Compute the test statistic. (Round to two decimal places as needed.) c. Find the P-value of the test statistic. The P-value of the test statistic isO (Round to three decimal places as needed.) d. Does the use of the single line appear to reduce the variation among waiting times There V sufficient evidence to conclude that the single line reduced the variation among waiting times because Ho is V by the hypothesis test.
The data table contains waiting times of customers at a bank, where customers enter a single waiting line that feeds three teller windows. Test the claim that the standard deviation of waiting times is less than 2.3 minutes, which is the standard deviation of waiting times at the same bank when separate waiting lines are used at each teller window. Use a significance level of 0.025. Complete parts (a) through (d) below. E Click on the icon to view the data. O A. Họ: a=2.3 minutes HA a<23 minutes OB. H: a<2.3 minutes HA: a=2.3 minutes OD. H: 0223 minutes OC. Họ: 0=23 minutes HA a2.3 minutes HA: a<2.3 minutes b. Compute the test statistic. (Round to two decimal places as needed.) c. Find the P-value of the test statistic. The P-value of the test statistic isO (Round to three decimal places as needed.) d. Does the use of the single line appear to reduce the variation among waiting times There V sufficient evidence to conclude that the single line reduced the variation among waiting times because Ho is V by the hypothesis test.

Glencoe Algebra 1, Student Edition, 9780079039897, 0079039898, 2018
18th Edition
ISBN:9780079039897
Author:Carter
Publisher:Carter
Chapter10: Statistics
Section10.4: Distributions Of Data
Problem 19PFA

Related questions
Question

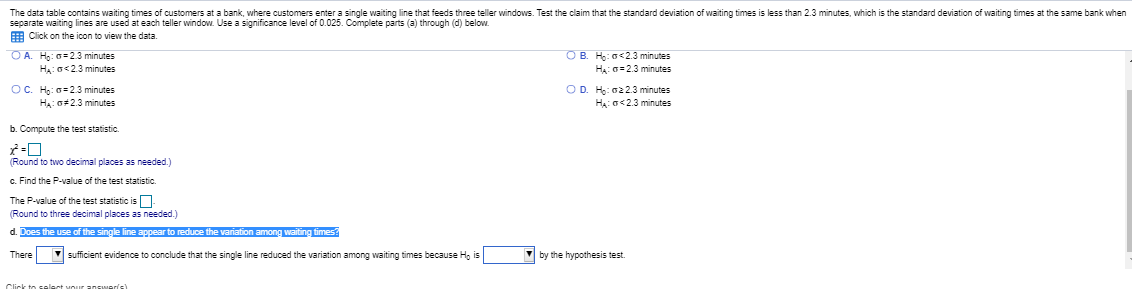
Transcribed Image Text:The data table contains waiting times of customers at a bank, where customers enter a single waiting line that feeds three teller windows. Test the claim that the standard deviation of waiting times is less than 2.3 minutes, which is the standard deviation of waiting times at the same bank when
separate waiting lines are used at each teller window. Use a significance level of 0.025. Complete parts (a) through (d) below.
E Click on the icon to view the data.
O A. Họ: a=2.3 minutes
HA a<23 minutes
OB. H: a<2.3 minutes
HA: a=2.3 minutes
OD. H: 0223 minutes
OC. Họ: 0=23 minutes
HA a2.3 minutes
HA: a<2.3 minutes
b. Compute the test statistic.
(Round to two decimal places as needed.)
c. Find the P-value of the test statistic.
The P-value of the test statistic isO
(Round to three decimal places as needed.)
d. Does the use of the single line appear to reduce the variation among waiting times
There
V sufficient evidence to conclude that the single line reduced the variation among waiting times because Ho is
V by the hypothesis test.
Expert Solution
This question has been solved!
Explore an expertly crafted, step-by-step solution for a thorough understanding of key concepts.

This is a popular solution!

Trending now
This is a popular solution!

Step by step
Solved in 4 steps

Knowledge Booster


Learn more about
Need a deep-dive on the concept behind this application? Look no further. Learn more about this topic, statistics and related others by exploring similar questions and additional content below.Recommended textbooks for you
Glencoe Algebra 1, Student Edition, 9780079039897…
Algebra
ISBN:
9780079039897
Author:
Carter
Publisher:
McGraw Hill
Glencoe Algebra 1, Student Edition, 9780079039897…
Algebra
ISBN:
9780079039897
Author:
Carter
Publisher:
McGraw Hill