The accompanying table gives the number of men 65 years or older in the United States and the percentage of men age 65 or older living below the poverty level. Men 65 years or older, m (millions) Percentage below poverty level, p Year 1970 8.3 20.2 1980 10.3 11.1 1985 11.0 8.7 1990 12.6 7.8 1997 14.0 7.0 2000 14.4 7.5 (a) Using time as the input, find a linear model for the data set for the number men 65 years or older in the United States. (Let x be the years since 1970. Round all numerical values to three decimal places.) m(x) = 0.209x + 8.208 million is the number of men in the U.S. 65 years and older x years after 1970, 0 < x < 30 . Using time as the input, find a quadratic model for the data set for the percentage of men age 65 or older below poverty level. (Let x be the years since 1970. Round all numerical values to three decimal places.) p(x) = 0.022x² – 1.085x + 20.070 % is the percentage of men in the U.S. of age 65 and older living below the poverty level x years after 1970, 0 < x< 30. The total number of U.S. men of age 65 and older living below the poverty level is given by the function I(x) = m(x) · p(x) / 100 million men. (b) How rapidly was the number of male senior citizens living below the poverty level changing in 1980 and in 1990? (Round your answer to three decimal places.) 1980 x million men per year 1990 x million men per year
The accompanying table gives the number of men 65 years or older in the United States and the percentage of men age 65 or older living below the poverty level. Men 65 years or older, m (millions) Percentage below poverty level, p Year 1970 8.3 20.2 1980 10.3 11.1 1985 11.0 8.7 1990 12.6 7.8 1997 14.0 7.0 2000 14.4 7.5 (a) Using time as the input, find a linear model for the data set for the number men 65 years or older in the United States. (Let x be the years since 1970. Round all numerical values to three decimal places.) m(x) = 0.209x + 8.208 million is the number of men in the U.S. 65 years and older x years after 1970, 0 < x < 30 . Using time as the input, find a quadratic model for the data set for the percentage of men age 65 or older below poverty level. (Let x be the years since 1970. Round all numerical values to three decimal places.) p(x) = 0.022x² – 1.085x + 20.070 % is the percentage of men in the U.S. of age 65 and older living below the poverty level x years after 1970, 0 < x< 30. The total number of U.S. men of age 65 and older living below the poverty level is given by the function I(x) = m(x) · p(x) / 100 million men. (b) How rapidly was the number of male senior citizens living below the poverty level changing in 1980 and in 1990? (Round your answer to three decimal places.) 1980 x million men per year 1990 x million men per year

College Algebra (MindTap Course List)
12th Edition
ISBN:9781305652231
Author:R. David Gustafson, Jeff Hughes
Publisher:R. David Gustafson, Jeff Hughes
Chapter8: Sequences, Series, And Probability
Section8.CR: Chapter Review
Problem 37E: Find the positive geometric mean between 4 and 64.

Related questions
Question
I need help with the bottom two questions in the image.
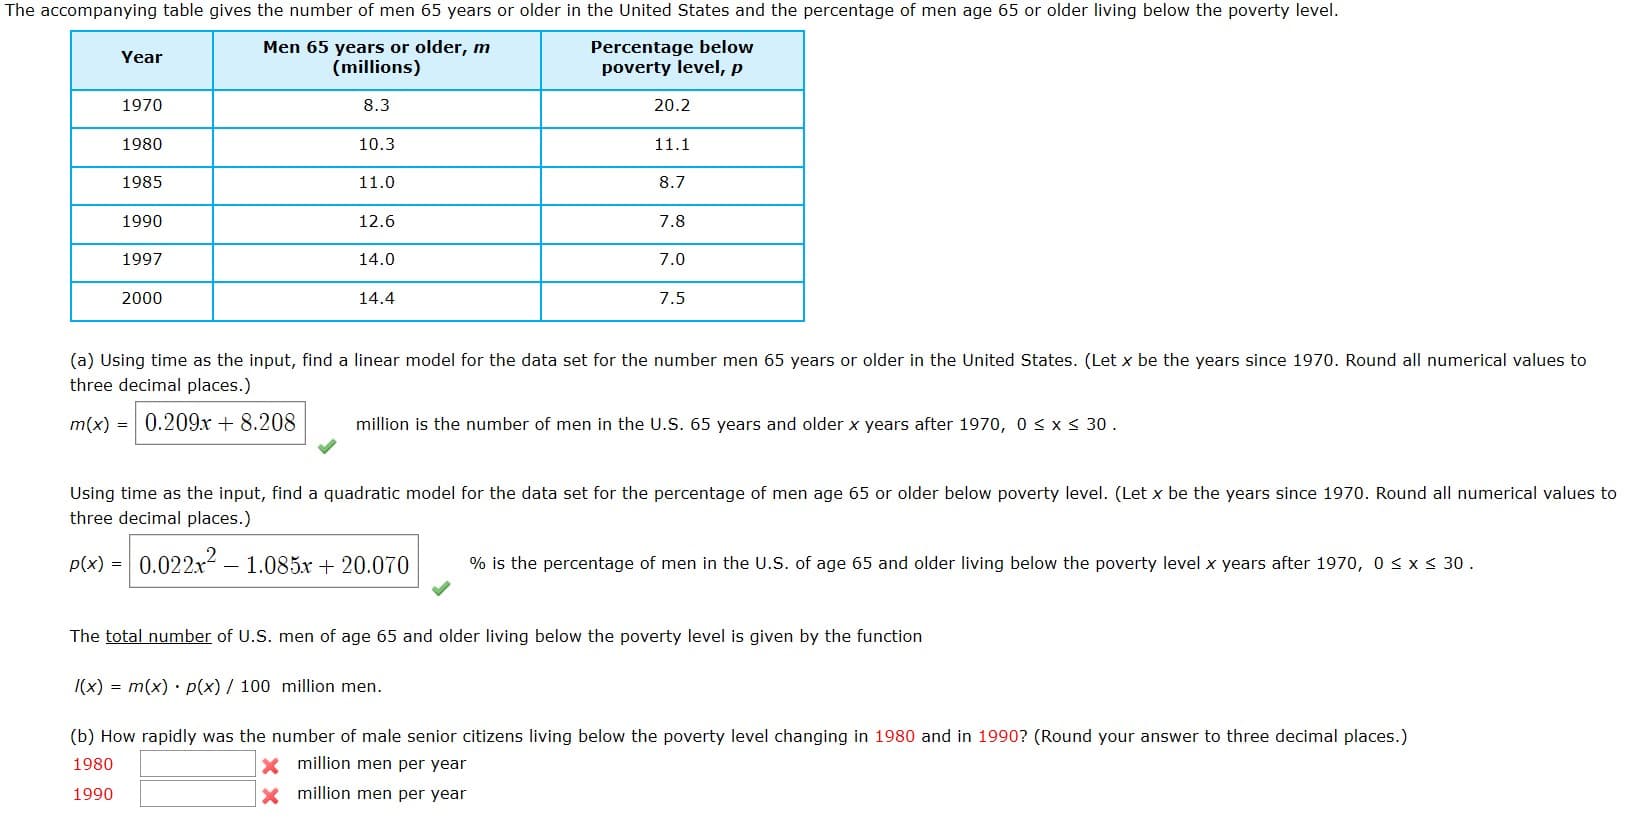
Transcribed Image Text:The accompanying table gives the number of men 65 years or older in the United States and the percentage of men age 65 or older living below the poverty level.
Men 65 years or older, m
(millions)
Percentage below
poverty level, p
Year
1970
8.3
20.2
1980
10.3
11.1
1985
11.0
8.7
1990
12.6
7.8
1997
14.0
7.0
2000
14.4
7.5
(a) Using time as the input, find a linear model for the data set for the number men 65 years or older in the United States. (Let x be the years since 1970. Round all numerical values to
three decimal places.)
m(x) = 0.209x + 8.208
million is the number of men in the U.S. 65 years and older x years after 1970, 0 < x < 30 .
Using time as the input, find a quadratic model for the data set for the percentage of men age 65 or older below poverty level. (Let x be the years since 1970. Round all numerical values to
three decimal places.)
p(x) = 0.022x² – 1.085x + 20.070
% is the percentage of men in the U.S. of age 65 and older living below the poverty level x years after 1970, 0 < x< 30.
The total number of U.S. men of age 65 and older living below the poverty level is given by the function
I(x) = m(x) · p(x) / 100 million men.
(b) How rapidly was the number of male senior citizens living below the poverty level changing in 1980 and in 1990? (Round your answer to three decimal places.)
1980
x million men per year
1990
x million men per year
Expert Solution
This question has been solved!
Explore an expertly crafted, step-by-step solution for a thorough understanding of key concepts.

This is a popular solution!

Trending now
This is a popular solution!

Step by step
Solved in 6 steps with 5 images

Knowledge Booster


Learn more about
Need a deep-dive on the concept behind this application? Look no further. Learn more about this topic, calculus and related others by exploring similar questions and additional content below.Recommended textbooks for you
College Algebra (MindTap Course List)
Algebra
ISBN:
9781305652231
Author:
R. David Gustafson, Jeff Hughes
Publisher:
Cengage Learning
College Algebra (MindTap Course List)
Algebra
ISBN:
9781305652231
Author:
R. David Gustafson, Jeff Hughes
Publisher:
Cengage Learning