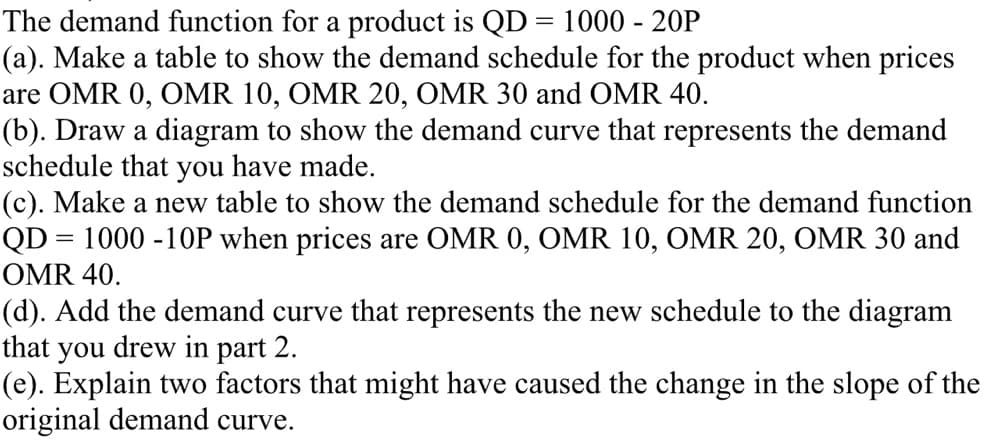
The demand function for a product is QD = 1000 - 20P (a). Make a table to show the demand schedule for the product when prices are OMR 0, OMR 10, OMR 20, OMR 30 and OMR 40. (b). Draw a diagram to show the demand curve that represents the demand schedule that you have made. (c). Make a new table to show the demand schedule for the demand function QD = 1000 -10P when prices are OMR 0, OMR 10, OMR 20, OMR 30 and OMR 40. (d). Add the demand curve that represents the new schedule to the diagram that you drew in part 2. (e). Explain two factors that might have caused the change in the slope of the original demand curve.
The demand function for a product is QD = 1000 - 20P (a). Make a table to show the demand schedule for the product when prices are OMR 0, OMR 10, OMR 20, OMR 30 and OMR 40. (b). Draw a diagram to show the demand curve that represents the demand schedule that you have made. (c). Make a new table to show the demand schedule for the demand function QD = 1000 -10P when prices are OMR 0, OMR 10, OMR 20, OMR 30 and OMR 40. (d). Add the demand curve that represents the new schedule to the diagram that you drew in part 2. (e). Explain two factors that might have caused the change in the slope of the original demand curve.
Managerial Economics: A Problem Solving Approach
5th Edition
ISBN:9781337106665
Author:Luke M. Froeb, Brian T. McCann, Michael R. Ward, Mike Shor
Publisher:Luke M. Froeb, Brian T. McCann, Michael R. Ward, Mike Shor
Chapter17: Making Decisions With Uncertainty
Section: Chapter Questions
Problem 17.1IP
Related questions
Question

Transcribed Image Text:The demand function for a product is QD = 1000 - 20P
(a). Make a table to show the demand schedule for the product when prices
are OMR 0, OMR 10, OMR 20, OMR 30 and OMR 40.
(b). Draw a diagram to show the demand curve that represents the demand
schedule that you have made.
(c). Make a new table to show the demand schedule for the demand function
QD = 1000 -10P when prices are OMR 0, OMR 10, OMR 20, OMR 30 and
OMR 40.
(d). Add the demand curve that represents the new schedule to the diagram
that you drew in part 2.
(e). Explain two factors that might have caused the change in the slope of the
original demand curve.
Expert Solution
This question has been solved!
Explore an expertly crafted, step-by-step solution for a thorough understanding of key concepts.
Step by step
Solved in 4 steps with 1 images

Recommended textbooks for you

Managerial Economics: A Problem Solving Approach
Economics
ISBN:
9781337106665
Author:
Luke M. Froeb, Brian T. McCann, Michael R. Ward, Mike Shor
Publisher:
Cengage Learning

Managerial Economics: A Problem Solving Approach
Economics
ISBN:
9781337106665
Author:
Luke M. Froeb, Brian T. McCann, Michael R. Ward, Mike Shor
Publisher:
Cengage Learning