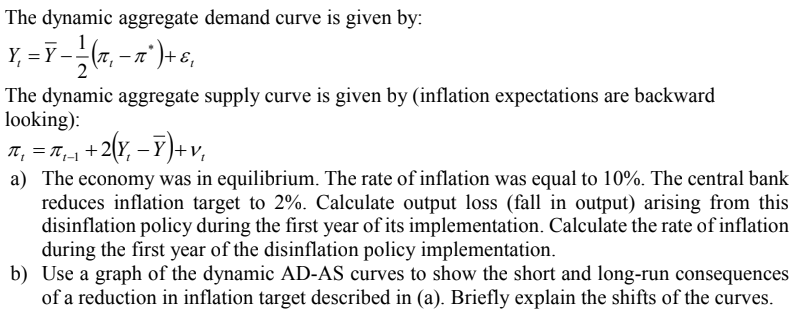
The dynamic aggregate demand curve is given by: Y‚ = Ỹ − ½ (7₁ − nª ) + ε, The dynamic aggregate supply curve is given by (inflation expectations are backward looking): π₁ = π₁_₁ + 2(Y₁ − Ỹ)+v₁ a) The economy was in equilibrium. The rate of inflation was equal to 10%. The central bank reduces inflation target to 2%. Calculate output loss (fall in output) arising from this disinflation policy during the first year of its implementation. Calculate the rate of inflation during the first year of the disinflation policy implementation. b) Use a graph of the dynamic AD-AS curves to show the short and long-run consequences of a reduction in inflation target described in (a). Briefly explain the shifts of the curves.
The dynamic aggregate demand curve is given by: Y‚ = Ỹ − ½ (7₁ − nª ) + ε, The dynamic aggregate supply curve is given by (inflation expectations are backward looking): π₁ = π₁_₁ + 2(Y₁ − Ỹ)+v₁ a) The economy was in equilibrium. The rate of inflation was equal to 10%. The central bank reduces inflation target to 2%. Calculate output loss (fall in output) arising from this disinflation policy during the first year of its implementation. Calculate the rate of inflation during the first year of the disinflation policy implementation. b) Use a graph of the dynamic AD-AS curves to show the short and long-run consequences of a reduction in inflation target described in (a). Briefly explain the shifts of the curves.

Chapter20: Monetary Policy
Section20.A: Policy Disputes Using The Self Correcting Aggregate Demand And Supply Model
Problem 3SQP

Related questions
Question
9
Transcribed Image Text:The dynamic aggregate demand curve is given by:
Y₁ = Ỹ — — — (π, — πª) + ε₁
The dynamic aggregate supply curve is given by (inflation expectations are backward
looking):
π₁ = π₁_₁ +2
+ 2(Y₁ - Y)+ V₁
a) The economy was in equilibrium. The rate of inflation was equal to 10%. The central bank
reduces inflation target to 2%. Calculate output loss (fall in output) arising from this
disinflation policy during the first year of its implementation. Calculate the rate of inflation
during the first year of the disinflation policy implementation.
b) Use a graph of the dynamic AD-AS curves to show the short and long-run consequences
of a reduction in inflation target described in (a). Briefly explain the shifts of the curves.
Expert Solution
This question has been solved!
Explore an expertly crafted, step-by-step solution for a thorough understanding of key concepts.

Step by step
Solved in 3 steps with 2 images

Knowledge Booster


Learn more about
Need a deep-dive on the concept behind this application? Look no further. Learn more about this topic, economics and related others by exploring similar questions and additional content below.Recommended textbooks for you

