The effect of expectations on the Phillips curve is considered a Phelps’s primary contribution. We can use a modified version of the Phillips curve to illustrate the point that Phelps was trying to make. The key difference is that the position of this new kind of curve changes when the inflation rate that people expect changes. When actual inflation changes and expected inflation stays the same, you move along the curve. But when expected inflation changes, the entire curve shifts. Since expectations shift this curve, economists call it an expectations-augmented Phillips curve. The following graph shows a Phillips curve for a hypothetical economy where the natural rate of unemployment is 8%. Initially, the expected inflation rate equals the actual inflation rate of 4%. Use the Phillips curve on the graph to answer the questions that follow. Consider a scenario where the inflation rate unexpectedly rises from 4% to 5%. Wages rise to match the new level of inflation. Workers believe that their wages are rising more quickly than the 4% rate they initially anticipated. As a result, the number of employed workers voluntarily leaving their jobs each month will decline, and the unemployment rate will fall. Show the effect of the unexpected increase in the inflation rate on the following graph of the Phillips curve. (Hint: To move the curve, select and drag any part of the curve except the point. To move the point, select and drag the point along the curve. If you want to move both, first move the curve and then move the point. The curve and point will snap into position, so if you try to move one and it snaps back to its original position, just try again and drag it a little farther.) The previous question interpreted the Phillips curve by saying that an unexpected increase in inflation causes a reduction in unemployment below the natural rate. There is another way to interpret this relation. It could be that a reduction in the unemployment rate causes an unexpected increase in inflation. To see how this might happen, imagine that the government unexpectedly increases government spending on weapons production due to the sudden outbreak of war. To meet their new obligations to produce more weapons, firms in the defense industry go on a hiring spree. To attract unemployed workers quickly, the defense firms offer wages that are higher than those offered by other firms. To prevent their employees from defecting to defense industry jobs, the firms in other industries have to increase their wages by more than the expected inflation rate. Since the rising wages drive up firm production costs, they also raise their prices by more than they had planned to. So the increase in wages used to increase employment (and thus decrease unemployment) causes an unexpected increase in the inflation rate. On the following graph, show the effect of a reduction in unemployment from 8% to 6% that causes an increase in the actual inflation rate from 4% to 5%.
The effect of expectations on the Phillips curve is considered a Phelps’s primary contribution. We can use a modified version of the Phillips curve to illustrate the point that Phelps was trying to make. The key difference is that the position of this new kind of curve changes when the inflation rate that people expect changes. When actual inflation changes and expected inflation stays the same, you move along the curve. But when expected inflation changes, the entire curve shifts. Since expectations shift this curve, economists call it an expectations-augmented Phillips curve. The following graph shows a Phillips curve for a hypothetical economy where the natural rate of unemployment is 8%. Initially, the expected inflation rate equals the actual inflation rate of 4%. Use the Phillips curve on the graph to answer the questions that follow. Consider a scenario where the inflation rate unexpectedly rises from 4% to 5%. Wages rise to match the new level of inflation. Workers believe that their wages are rising more quickly than the 4% rate they initially anticipated. As a result, the number of employed workers voluntarily leaving their jobs each month will decline, and the unemployment rate will fall. Show the effect of the unexpected increase in the inflation rate on the following graph of the Phillips curve. (Hint: To move the curve, select and drag any part of the curve except the point. To move the point, select and drag the point along the curve. If you want to move both, first move the curve and then move the point. The curve and point will snap into position, so if you try to move one and it snaps back to its original position, just try again and drag it a little farther.) The previous question interpreted the Phillips curve by saying that an unexpected increase in inflation causes a reduction in unemployment below the natural rate. There is another way to interpret this relation. It could be that a reduction in the unemployment rate causes an unexpected increase in inflation. To see how this might happen, imagine that the government unexpectedly increases government spending on weapons production due to the sudden outbreak of war. To meet their new obligations to produce more weapons, firms in the defense industry go on a hiring spree. To attract unemployed workers quickly, the defense firms offer wages that are higher than those offered by other firms. To prevent their employees from defecting to defense industry jobs, the firms in other industries have to increase their wages by more than the expected inflation rate. Since the rising wages drive up firm production costs, they also raise their prices by more than they had planned to. So the increase in wages used to increase employment (and thus decrease unemployment) causes an unexpected increase in the inflation rate. On the following graph, show the effect of a reduction in unemployment from 8% to 6% that causes an increase in the actual inflation rate from 4% to 5%.

Chapter17: The Philips Curve And Expetactions Theory
Section: Chapter Questions
Problem 2SQ

Related questions
Question
The effect of expectations on the Phillips curve is considered a Phelps’s primary contribution. We can use a modified version of the Phillips curve to illustrate the point that Phelps was trying to make. The key difference is that the position of this new kind of curve changes when the inflation rate that people expect changes. When actual inflation changes and expected inflation stays the same, you move along the curve. But when expected inflation changes, the entire curve shifts. Since expectations shift this curve, economists call it an expectations-augmented Phillips curve.
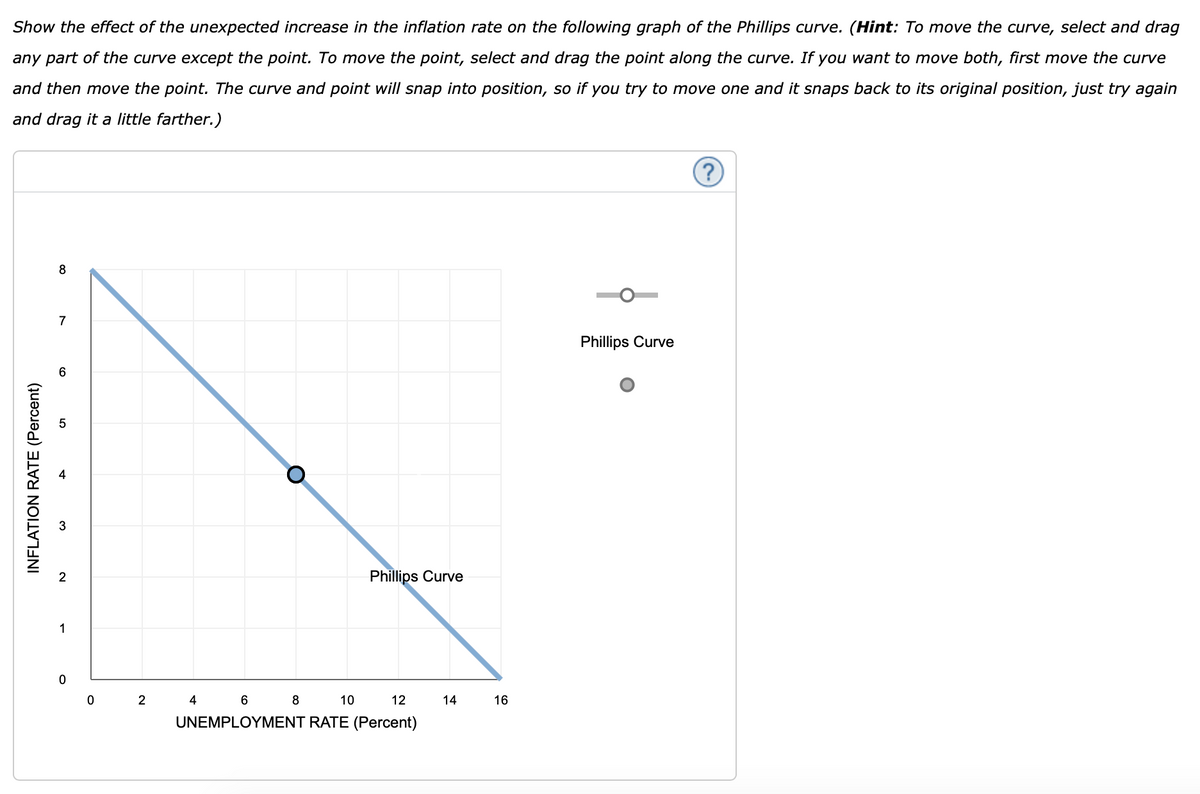
The following graph shows a Phillips curve for a hypothetical economy where the natural rate of unemployment is 8%. Initially, the expected inflation rate equals the actual inflation rate of 4%. Use the Phillips curve on the graph to answer the questions that follow.
Consider a scenario where the inflation rate unexpectedly rises from 4% to 5%. Wages rise to match the new level of inflation. Workers believe that their wages are rising more quickly than the 4% rate they initially anticipated. As a result, the number of employed workers voluntarily leaving their jobs each month will decline, and the unemployment rate will fall.
Show the effect of the unexpected increase in the inflation rate on the following graph of the Phillips curve. (Hint: To move the curve, select and drag any part of the curve except the point. To move the point, select and drag the point along the curve. If you want to move both, first move the curve and then move the point. The curve and point will snap into position, so if you try to move one and it snaps back to its original position, just try again and drag it a little farther.)
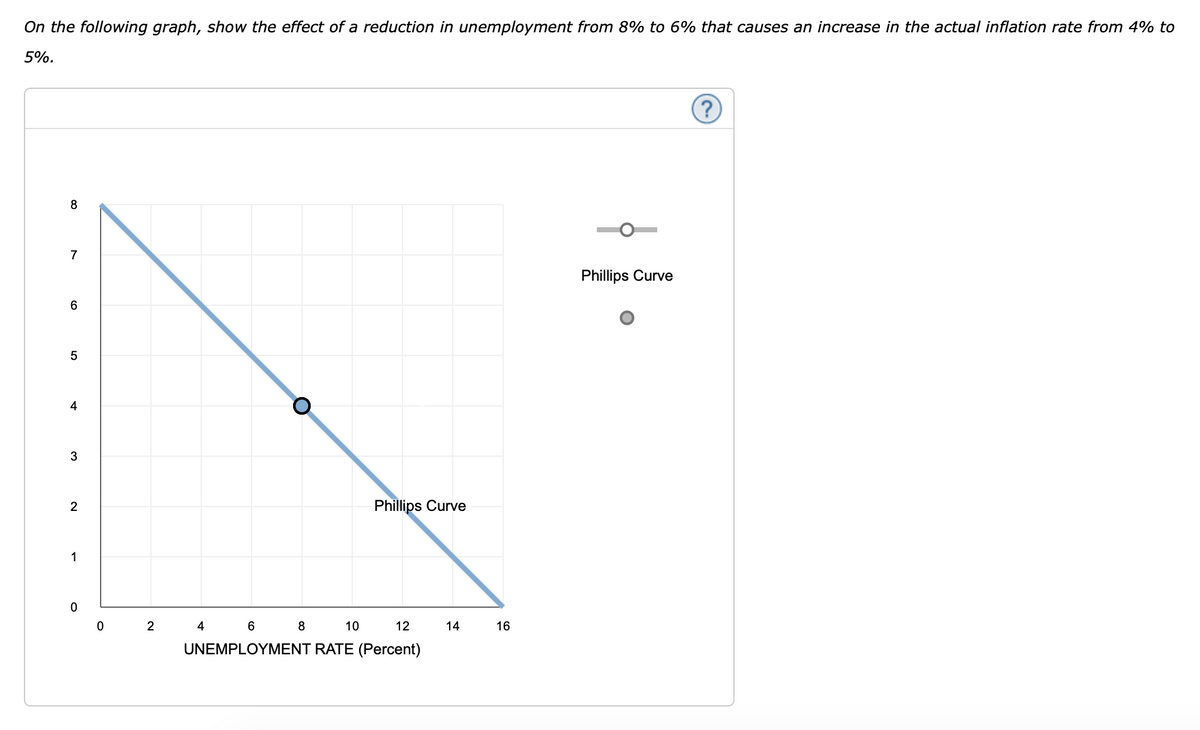
The previous question interpreted the Phillips curve by saying that an unexpected increase in inflation causes a reduction in unemployment below the natural rate. There is another way to interpret this relation. It could be that a reduction in the unemployment rate causes an unexpected increase in inflation.
To see how this might happen, imagine that the government unexpectedly increases government spending on weapons production due to the sudden outbreak of war. To meet their new obligations to produce more weapons, firms in the defense industry go on a hiring spree. To attract unemployed workers quickly, the defense firms offer wages that are higher than those offered by other firms. To prevent their employees from defecting to defense industry jobs, the firms in other industries have to increase their wages by more than the expected inflation rate. Since the rising wages drive up firm production costs, they also raise their prices by more than they had planned to. So the increase in wages used to increase employment (and thus decrease unemployment) causes an unexpected increase in the inflation rate.
On the following graph, show the effect of a reduction in unemployment from 8% to 6% that causes an increase in the actual inflation rate from 4% to 5%.
Transcribed Image Text:Show the effect of the unexpected increase in the inflation rate on the following graph of the Phillips curve. (Hint: To move the curve, select and drag
any part of the curve except the point. To move the point, select and drag the point along the curve. If you want to move both, first move the curve
and then move the point. The curve and point will snap into position, so if you try to move one and it snaps back to its original position, just try again
and drag it a little farther.)
INFLATION RATE (Percent)
8
7
2
1
0
0
2
Phillips Curve
4 6 8
10
12
UNEMPLOYMENT RATE (Percent)
14
16
Phillips Curve
(?)
Transcribed Image Text:On the following graph, show the effect of a reduction in unemployment from 8% to 6% that causes an increase in the actual inflation rate from 4% to
5%.
8
7
6
5
4
3
2
1
0
0
2
O
Phillips Curve
8
4 6
10
12
UNEMPLOYMENT RATE (Percent)
14
16
Phillips Curve
?
Expert Solution
This question has been solved!
Explore an expertly crafted, step-by-step solution for a thorough understanding of key concepts.

This is a popular solution!

Trending now
This is a popular solution!

Step by step
Solved in 2 steps with 3 images

Knowledge Booster


Learn more about
Need a deep-dive on the concept behind this application? Look no further. Learn more about this topic, economics and related others by exploring similar questions and additional content below.Recommended textbooks for you


Exploring Economics
Economics
ISBN:
9781544336329
Author:
Robert L. Sexton
Publisher:
SAGE Publications, Inc
Exploring Economics
Economics
ISBN:
9781544336329
Author:
Robert L. Sexton
Publisher:
SAGE Publications, Inc


Principles of Economics (MindTap Course List)
Economics
ISBN:
9781305585126
Author:
N. Gregory Mankiw
Publisher:
Cengage Learning

Brief Principles of Macroeconomics (MindTap Cours…
Economics
ISBN:
9781337091985
Author:
N. Gregory Mankiw
Publisher:
Cengage Learning