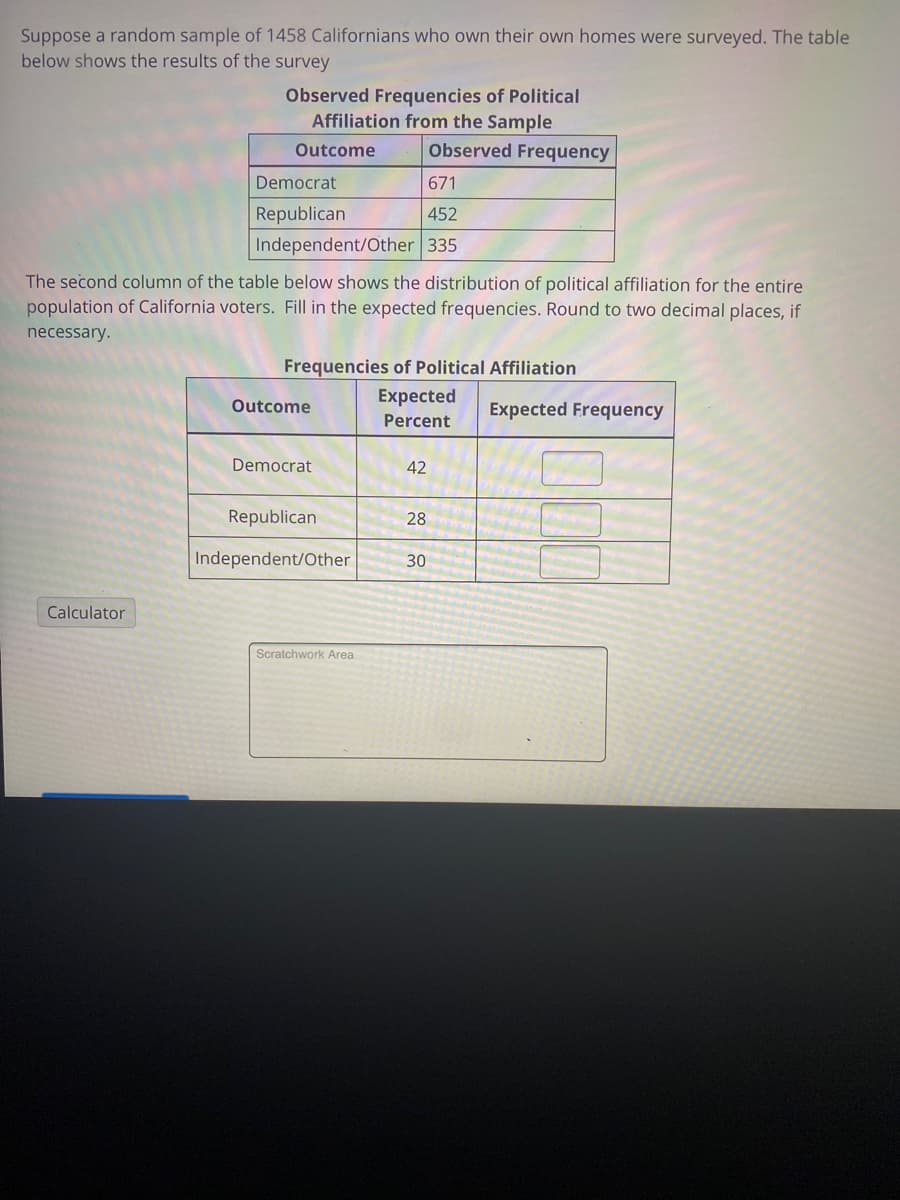
Suppose a random sample of 1458 Californians who own their own homes were surveyed. The table below shows the results of the survey Observed Frequencies of Political Affiliation from the Sample Outcome Observed Frequency Democrat 671 Republican 452 Independent/Other 335 The second column of the table below shows the distribution of political affiliation for the entire population of California voters. Fill in the expected frequencies. Round to two decimal places, if necessary. Frequencies of Political Affiliation Expected Outcome Expected Frequency Percent Democrat 42 Republican 28 Independent/Other 30 Calculator Scratchwork Area
Suppose a random sample of 1458 Californians who own their own homes were surveyed. The table below shows the results of the survey Observed Frequencies of Political Affiliation from the Sample Outcome Observed Frequency Democrat 671 Republican 452 Independent/Other 335 The second column of the table below shows the distribution of political affiliation for the entire population of California voters. Fill in the expected frequencies. Round to two decimal places, if necessary. Frequencies of Political Affiliation Expected Outcome Expected Frequency Percent Democrat 42 Republican 28 Independent/Other 30 Calculator Scratchwork Area

Glencoe Algebra 1, Student Edition, 9780079039897, 0079039898, 2018
18th Edition
ISBN:9780079039897
Author:Carter
Publisher:Carter
Chapter10: Statistics
Section10.6: Summarizing Categorical Data
Problem 10CYU

Related questions

Topic Video
Question
I need help with this question
Transcribed Image Text:Suppose a random sample of 1458 Californians who own their own homes were surveyed. The table
below shows the results of the survey
Observed Frequencies of Political
Affiliation from the Sample
Outcome
Observed Frequency
Democrat
671
Republican
452
Independent/Other 335
The second column of the table below shows the distribution of political affiliation for the entire
population of California voters. Fill in the expected frequencies. Round to two decimal places, if
necessary.
Frequencies of Political Affiliation
Expected
Outcome
Expected Frequency
Percent
Democrat
42
Republican
28
Independent/Other
30
Calculator
Scratchwork Area
Expert Solution
This question has been solved!
Explore an expertly crafted, step-by-step solution for a thorough understanding of key concepts.

This is a popular solution!

Trending now
This is a popular solution!

Step by step
Solved in 2 steps

Knowledge Booster


Learn more about
Need a deep-dive on the concept behind this application? Look no further. Learn more about this topic, statistics and related others by exploring similar questions and additional content below.Recommended textbooks for you
Glencoe Algebra 1, Student Edition, 9780079039897…
Algebra
ISBN:
9780079039897
Author:
Carter
Publisher:
McGraw Hill

Holt Mcdougal Larson Pre-algebra: Student Edition…
Algebra
ISBN:
9780547587776
Author:
HOLT MCDOUGAL
Publisher:
HOLT MCDOUGAL

College Algebra (MindTap Course List)
Algebra
ISBN:
9781305652231
Author:
R. David Gustafson, Jeff Hughes
Publisher:
Cengage Learning
Glencoe Algebra 1, Student Edition, 9780079039897…
Algebra
ISBN:
9780079039897
Author:
Carter
Publisher:
McGraw Hill
Holt Mcdougal Larson Pre-algebra: Student Edition…
Algebra
ISBN:
9780547587776
Author:
HOLT MCDOUGAL
Publisher:
HOLT MCDOUGAL
College Algebra (MindTap Course List)
Algebra
ISBN:
9781305652231
Author:
R. David Gustafson, Jeff Hughes
Publisher:
Cengage Learning
