The National Football League (NFL) records a variety of performance data for individuals and teams. To investigate the importance of passing on the percentage of games won by a team, the following data show the conference (Conf), average number of passing yards per attempt (Yds/Att), the number of interceptions thrown per attempt (Int/Att), and the percentage of games won (Win%) for a random sample of 16 NFL teams for the 2011 season (NFL web site, February 12, 2012). Click on the datafile logo to reference the data. DATA file Team Arizona Cardinals Atlanta Falcons Carolina Panthers Cincinnati Bengals Conference Yds/Att Int/Att Win% NFC 6.5 0.042 50.0 NFC 7.1 0.022 62.5 NFC 7.4 0.033 37.5 AFC 6.2 0.026 56.3 Detroit Lions NFC 7.2 0.024 62.5 Green Bay Packers NFC 8.9 0.014 93.8 Houstan Texans AFC 7.5 0.019 62.5 Indianapolis Colts llacksonville Jaguars AFC 5.6 0.026 12.5 AFC 4.6 0.032 31.3 Minnesota Vikings New England Patriots NFC 5.8 0.033 18.8 AFC 8.3 0.020 81.3 New Orleans Saints lOakland Raiders NFC 8.1 0.021 81.3 AFC 7.6 0.044 50.0 San Francisco 49ers NFC 6.5 0.011 81.3 Tennessee Titans AFC 6.7 0.024 56.3 Washington Redskins NFC 6.4 0.041 31.3
The National Football League (NFL) records a variety of performance data for individuals and teams. To investigate the importance of passing on the percentage of games won by a team, the following data show the conference (Conf), average number of passing yards per attempt (Yds/Att), the number of interceptions thrown per attempt (Int/Att), and the percentage of games won (Win%) for a random sample of 16 NFL teams for the 2011 season (NFL web site, February 12, 2012). Click on the datafile logo to reference the data. DATA file Team Arizona Cardinals Atlanta Falcons Carolina Panthers Cincinnati Bengals Conference Yds/Att Int/Att Win% NFC 6.5 0.042 50.0 NFC 7.1 0.022 62.5 NFC 7.4 0.033 37.5 AFC 6.2 0.026 56.3 Detroit Lions NFC 7.2 0.024 62.5 Green Bay Packers NFC 8.9 0.014 93.8 Houstan Texans AFC 7.5 0.019 62.5 Indianapolis Colts llacksonville Jaguars AFC 5.6 0.026 12.5 AFC 4.6 0.032 31.3 Minnesota Vikings New England Patriots NFC 5.8 0.033 18.8 AFC 8.3 0.020 81.3 New Orleans Saints lOakland Raiders NFC 8.1 0.021 81.3 AFC 7.6 0.044 50.0 San Francisco 49ers NFC 6.5 0.011 81.3 Tennessee Titans AFC 6.7 0.024 56.3 Washington Redskins NFC 6.4 0.041 31.3

Glencoe Algebra 1, Student Edition, 9780079039897, 0079039898, 2018
18th Edition
ISBN:9780079039897
Author:Carter
Publisher:Carter
Chapter10: Statistics
Section10.6: Summarizing Categorical Data
Problem 10CYU

Related questions
Question
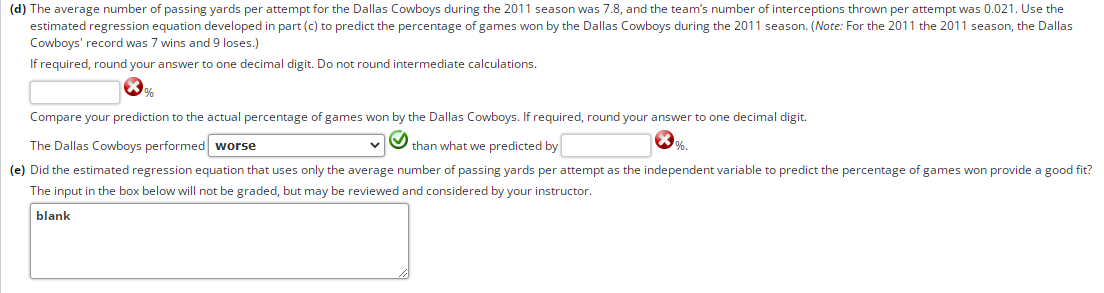
Transcribed Image Text:(d) The average number of passing yards per attempt for the Dallas Cowboys during the 2011 season was 7.8, and the team's number of interceptions thrown per attempt was 0.021. Use the
estimated regression equation developed in part (c) to predict the percentage of games won by the Dallas Cowboys during the 2011 season. (Note: For the 2011 the 2011 season, the Dallas
Cowboys' record was 7 wins and 9 loses.)
If required, round your answer to one decimal digit. Do not round intermediate calculations.
%
Compare your prediction to the actual percentage of games won by the Dallas Cowboys. If required, round your answer to one decimal digit.
The Dallas Cowboys performed worse
than what we predicted by
(e) Did the estimated regression equation that uses only the average number of passing yards per attempt as the independent variable to predict the percentage of games won provide a good fit?
The input in the box below will not be graded, but may be reviewed and considered by your instructor.
blank
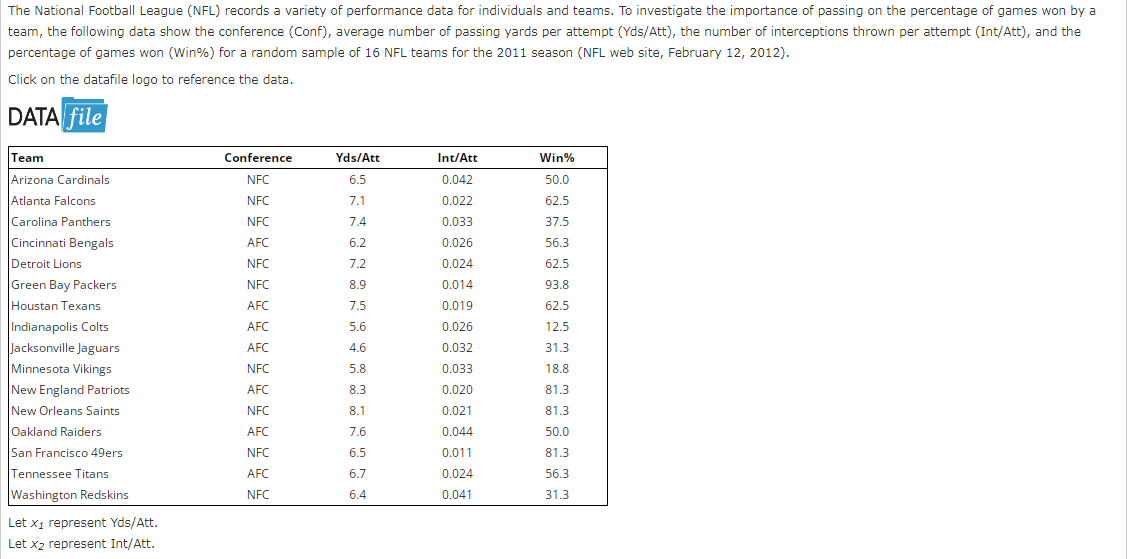
Transcribed Image Text:The National Football League (NFL) records a variety of performance data for individuals and teams. To investigate the importance of passing on the percentage of games won by a
team, the following data show the conference (Conf), average number of passing yards per attempt (Yds/Att), the number of interceptions thrown per attempt (Int/Att), and the
percentage of games won (Win%) for a random sample of 16 NFL teams for the 2011 season (NFL web site, February 12, 2012).
Click on the datafile logo to reference the data.
DATA file
Team
Arizona Cardinals
Atlanta Falcons
Carolina Panthers
Cincinnati Bengals
Conference
Yds/Att
Int/Att
Win%
NFC
6.5
0.042
50.0
NFC
7.1
0.022
62.5
NFC
7.4
0.033
37.5
AFC
6.2
0.026
56.3
Detroit Lions
NFC
7.2
0.024
62.5
Green Bay Packers
NFC
8.9
0.014
93.8
Houstan Texans
AFC
7.5
0.019
62.5
Indianapolis Colts
Jacksonville Jaguars
Minnesota Vikings
New England Patriots
AFC
5.6
0.026
12.5
AFC
4.6
0.032
31.3
NFC
5.8
0.033
18.8
AFC
8.3
0.020
81.3
New Orleans Saints
lOakland Raiders
NFC
8.1
0.021
81.3
AFC
7.6
0.044
50.0
San Francisco 49ers
NFC
6.5
0.011
81.3
Tennessee Titans
AFC
6.7
0.024
56.3
Washington Redskins
NFC
6.4
0.041
31.3
Let x1 represent Yds/Att.
Let x2 represent Int/Att.
Expert Solution
This question has been solved!
Explore an expertly crafted, step-by-step solution for a thorough understanding of key concepts.

This is a popular solution!

Trending now
This is a popular solution!

Step by step
Solved in 4 steps with 3 images

Recommended textbooks for you
Glencoe Algebra 1, Student Edition, 9780079039897…
Algebra
ISBN:
9780079039897
Author:
Carter
Publisher:
McGraw Hill

Holt Mcdougal Larson Pre-algebra: Student Edition…
Algebra
ISBN:
9780547587776
Author:
HOLT MCDOUGAL
Publisher:
HOLT MCDOUGAL
Glencoe Algebra 1, Student Edition, 9780079039897…
Algebra
ISBN:
9780079039897
Author:
Carter
Publisher:
McGraw Hill
Holt Mcdougal Larson Pre-algebra: Student Edition…
Algebra
ISBN:
9780547587776
Author:
HOLT MCDOUGAL
Publisher:
HOLT MCDOUGAL