The government is considering levying a tax of $60 per unit on suppliers of either concert tickets or bus passes. The supply curve for each of these two goods is identical, as you can see on each of the following graphs. The demand for concert tickets is shown by Dc (on the first graph), and the demand for bus passes is shown by Dg (on the second graph). Suppose the government taxes concert tickets. The following graph shows the annual supply and demand for this good. It also shows the supply curve (S + Tax) shifted up by the amount of the proposed tax ($60 per ticket). On the folowing graph, use the green rectangle (triangle symbols) to shade the area that represents tax revenue for concert tickets. Then use the black triangle (plus symbols) to shade the area that represents the deadweight loss associated with the tax. Concert Tickets Market 120 110 Supply S+Tax 100 Tax Revenue 90 80 Deadweight Loss 70 60 50 40 30 20 10 50 100 150 200 250 300 350 400 450 500 560 600 QUANTITY (Tickets) PRICE (Dollars per ticket)
The government is considering levying a tax of $60 per unit on suppliers of either concert tickets or bus passes. The supply curve for each of these two goods is identical, as you can see on each of the following graphs. The demand for concert tickets is shown by Dc (on the first graph), and the demand for bus passes is shown by Dg (on the second graph). Suppose the government taxes concert tickets. The following graph shows the annual supply and demand for this good. It also shows the supply curve (S + Tax) shifted up by the amount of the proposed tax ($60 per ticket). On the folowing graph, use the green rectangle (triangle symbols) to shade the area that represents tax revenue for concert tickets. Then use the black triangle (plus symbols) to shade the area that represents the deadweight loss associated with the tax. Concert Tickets Market 120 110 Supply S+Tax 100 Tax Revenue 90 80 Deadweight Loss 70 60 50 40 30 20 10 50 100 150 200 250 300 350 400 450 500 560 600 QUANTITY (Tickets) PRICE (Dollars per ticket)

Essentials of Economics (MindTap Course List)
8th Edition
ISBN:9781337091992
Author:N. Gregory Mankiw
Publisher:N. Gregory Mankiw
Chapter6: Supply, Demand And Government Policies
Section: Chapter Questions
Problem 7PA

Related questions
Question
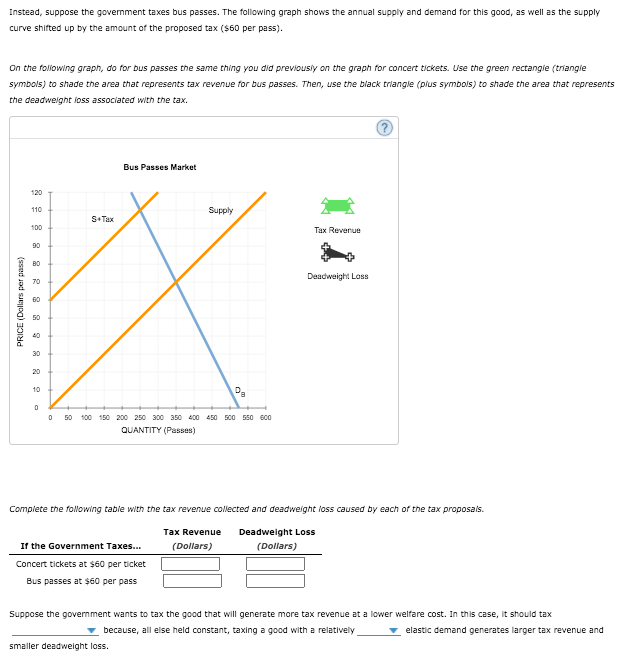
Transcribed Image Text:Instead, suppose the govemment taxes bus passes. The following graph shows the annual supply and demand for this good, as well as the supply
curve shifted up by the amount of the proposed tax (60 per pass).
On the folowing graph, do for bus passes the same thing you did previously on the graph for concert tickets. Use the green rectangie (trangie
symbols) to shade the area that represents tax revenue for bus passes. Then, use the black triangle (plus symbols) to shade the area that represents
the deadweight ioss associated with the tax.
Bus Passes Market
120
110
Supply
S+Tax
100
Tax Revenue
90
Deadweight Loss
70
60
50
20
30
20
Da
10
50 100 150 200 250 300 350 400 450 500 550 600
QUANTITY (Passes)
Complete the following table with the tax revenue collected and deadweight loss caused by each of the tax proposais.
Tax Revenue
Deadweight Los
If the Government Taxes...
(Dollars)
(Dollars)
Concert tickets at $60 per ticket
Bus passes at $60 per pass
Suppose the government wants to tax the good that will generate more tax revenue at a lower welfare cost. In this case, it should tax
- because, all else held constant, taxing a good with a relatively
elastic demand generates larger tax revenue and
smaller deadweight loss.
PRICE (Dollars per pass)
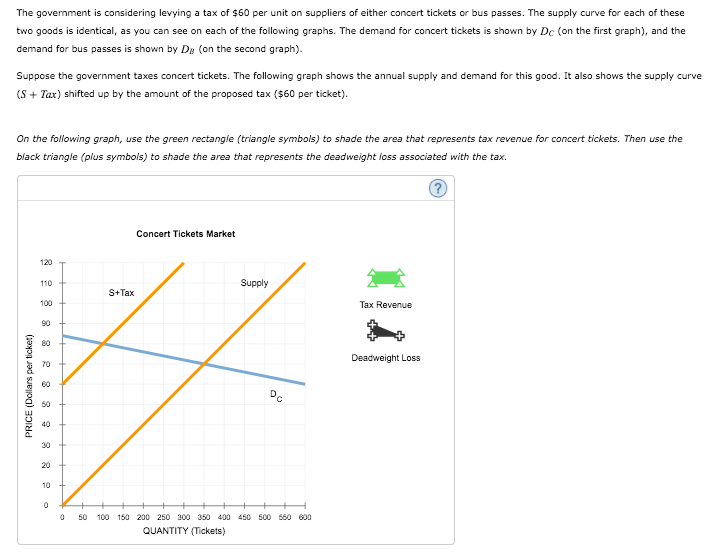
Transcribed Image Text:The government is considering levying a tax of $60 per unit on suppliers of either concert tickets or bus passes. The supply curve for each of these
two goods is identical, as you can see on each of the following graphs. The demand for concert tickets is shown by De (on the first graph), and the
demand for bus passes is shown by Dg (on the second graph).
Suppose the government taxes concert tickets. The following graph shows the annual supply and demand for this good. It also shows the supply curve
(S + Tax) shifted up by the amount of the proposed tax ($60 per ticket).
On the following graph, use the green rectangle (triangle symbols) to shade the area that represents tax revenue for concert tickets. Then use the
black triangle (plus symbols) to shade the area that represents the deadweight loss associated with the tax.
Concert Tickets Market
120
110 +
Supply
S+Tax
100
Tax Revenue
90
80
Deadweight Loss
70
60
50
40
30
20
10
50
100 150 200 250 300 350 400 450 500 550 600
QUANTITY (Tickets)
PRICE (Dollars per ticket)
Expert Solution
This question has been solved!
Explore an expertly crafted, step-by-step solution for a thorough understanding of key concepts.

This is a popular solution!

Trending now
This is a popular solution!

Step by step
Solved in 3 steps with 2 images

Recommended textbooks for you
Essentials of Economics (MindTap Course List)
Economics
ISBN:
9781337091992
Author:
N. Gregory Mankiw
Publisher:
Cengage Learning

Principles of Microeconomics
Economics
ISBN:
9781305156050
Author:
N. Gregory Mankiw
Publisher:
Cengage Learning

Essentials of Economics (MindTap Course List)
Economics
ISBN:
9781337091992
Author:
N. Gregory Mankiw
Publisher:
Cengage Learning
Principles of Microeconomics
Economics
ISBN:
9781305156050
Author:
N. Gregory Mankiw
Publisher:
Cengage Learning

Principles of Macroeconomics (MindTap Course List)
Economics
ISBN:
9781305971509
Author:
N. Gregory Mankiw
Publisher:
Cengage Learning

Principles of Economics, 7th Edition (MindTap Cou…
Economics
ISBN:
9781285165875
Author:
N. Gregory Mankiw
Publisher:
Cengage Learning

Principles of Macroeconomics (MindTap Course List)
Economics
ISBN:
9781285165912
Author:
N. Gregory Mankiw
Publisher:
Cengage Learning