1 Variables, Expressions, And Integers 2 Solving Equations 3 Multi-step Equations And Inequalities 4 Factors, Fractions, And Exponents 5 Rational Numbers And Equations 6 Ratio, Proportion, And Probability 7 Percents 8 Linear Functions 9 Real Numbers And Right Triangles 10 Measurement, Area, And Volume 11 Data Analysis And Probability 12 Angle Relationships And Transformations CSR Contents Of Student Resources ChapterCSR: Contents Of Student Resources
Chapter Questions Section: Chapter Questions
Problem 1.1P Problem 1.2P Problem 1.3P Problem 1.4P Problem 1.5P Problem 1.6P Problem 1.7P Problem 1.8P Problem 1.9P Problem 1.10P Problem 1.11P Problem 1.12P Problem 1.13P Problem 1.14P Problem 1.15P Problem 1.16P Problem 2.1P Problem 2.2P Problem 2.3P Problem 2.4P Problem 2.5P Problem 2.6P Problem 2.7P Problem 2.8P Problem 2.9P Problem 2.10P Problem 2.11P Problem 2.12P Problem 2.13P Problem 2.14P Problem 3.1P Problem 3.2P Problem 3.3P Problem 3.4P Problem 3.5P Problem 3.6P Problem 3.7P Problem 3.8P Problem 3.9P Problem 3.10P Problem 3.11P Problem 3.12P Problem 3.13P Problem 3.14P Problem 3.15P Problem 3.16P Problem 4.1P Problem 4.2P Problem 4.3P Problem 4.4P Problem 4.5P Problem 4.6P Problem 4.7P Problem 4.8P Problem 4.9P Problem 4.10P Problem 4.11P Problem 4.12P Problem 5.1P Problem 5.2P Problem 5.3P Problem 5.4P Problem 5.5P Problem 5.6P Problem 5.7P Problem 5.8P Problem 5.9P Problem 5.10P Problem 5.11P Problem 5.12P Problem 5.13P Problem 5.14P Problem 5.15P Problem 5.16P Problem 6.1P Problem 6.2P Problem 6.3P Problem 6.4P Problem 6.5P Problem 6.6P Problem 6.7P Problem 6.8P Problem 6.9P Problem 6.10P Problem 6.11P Problem 6.12P Problem 6.13P Problem 6.14P Problem 6.15P Problem 6.16P Problem 7.1P Problem 7.2P Problem 7.3P Problem 7.4P Problem 7.5P Problem 7.6P Problem 7.7P Problem 7.8P Problem 7.9P Problem 7.10P Problem 7.11P Problem 7.12P Problem 7.13P Problem 7.14P Problem 7.15P Problem 7.16P Problem 7.17P Problem 7.18P Problem 7.19P Problem 7.20P Problem 8.1P Problem 8.2P Problem 8.3P Problem 8.4P Problem 8.5P Problem 8.6P Problem 8.7P Problem 8.8P Problem 8.9P Problem 8.10P Problem 8.11P Problem 8.12P Problem 9.1P Problem 9.2P Problem 9.3P Problem 9.4P Problem 9.5P Problem 9.6P Problem 9.7P Problem 9.8P Problem 9.9P Problem 9.10P Problem 9.11P Problem 9.12P Problem 9.13P Problem 9.14P Problem 9.15P Problem 9.16P Problem 9.17P Problem 9.18P Problem 9.19P Problem 9.20P Problem 9.21P Problem 9.22P Problem 9.23P Problem 9.24P Problem 9.25P Problem 10.1P Problem 10.2P Problem 10.3P Problem 10.4P Problem 10.5P Problem 10.6P Problem 10.7P Problem 10.8P Problem 10.9P Problem 10.10P Problem 10.11P Problem 10.12P Problem 10.13P Problem 10.14P Problem 10.15P Problem 10.16P Problem 10.17P Problem 10.18P Problem 10.19P Problem 10.20P Problem 11.1P Problem 11.2P Problem 11.3P Problem 11.4P Problem 11.5P Problem 11.6P Problem 11.7P Problem 11.8P Problem 11.9P Problem 11.10P Problem 11.11P Problem 11.12P Problem 11.13P Problem 11.14P Problem 11.15P Problem 11.16P Problem 12.1P Problem 12.2P Problem 12.3P Problem 12.4P Problem 12.5P Problem 12.6P Problem 12.7P Problem 13.1P Problem 13.2P Problem 13.3P Problem 13.4P Problem 13.5P Problem 13.6P Problem 13.7P Problem 14.1P Problem 14.2P Problem 14.3P Problem 14.4P Problem 14.5P Problem 14.6P Problem 14.7P Problem 15.1P Problem 15.2P Problem 15.3P Problem 15.4P Problem 16.1P Problem 16.2P Problem 16.3P Problem 16.4P Problem 16.5P Problem 16.6P Problem 16.7P Problem 16.8P Problem 17.1P Problem 17.2P Problem 17.3P Problem 17.4P Problem 17.5P Problem 17.6P Problem 18.1P Problem 18.2P Problem 18.3P Problem 18.4P Problem 18.5P Problem 18.6P Problem 18.7P Problem 18.8P Problem 18.9P Problem 18.10P Problem 18.11P Problem 18.12P Problem 18.13P Problem 18.14P Problem 18.15P Problem 18.16P Problem 19.1P Problem 19.2P Problem 19.3P Problem 19.4P Problem 19.5P Problem 19.6P Problem 19.7P Problem 19.8P Problem 19.9P Problem 19.10P Problem 19.11P Problem 19.12P Problem 19.13P Problem 19.14P Problem 19.15P Problem 19.16P Problem 20.1P Problem 20.2P Problem 20.3P Problem 20.4P Problem 20.5P Problem 20.6P Problem 20.7P Problem 20.8P Problem 21.1P Problem 21.2P Problem 21.3P Problem 21.4P Problem 21.5P Problem 21.6P Problem 21.7P Problem 21.8P Problem 21.9P Problem 22.1P Problem 22.2P Problem 22.3P Problem 22.4P Problem 22.5P Problem 22.6P Problem 22.7P Problem 22.8P Problem 22.9P Problem 23.1P Problem 23.2P Problem 23.3P Problem 23.4P Problem 23.5P Problem 23.6P Problem 23.7P Problem 23.8P Problem 23.9P Problem 24.1P Problem 24.2P Problem 24.3P Problem 24.4P Problem 24.5P Problem 24.6P Problem 24.7P Problem 24.8P Problem 25.1P Problem 25.2P Problem 25.3P Problem 25.4P Problem 25.5P Problem 25.6P Problem 25.7P Problem 26.1P Problem 26.2P Problem 26.3P Problem 26.4P Problem 26.5P Problem 27.1P Problem 27.2P Problem 27.3P Problem 28.1P Problem 28.2P Problem 28.3P Problem 29.1P Problem 29.2P Problem 29.3P Problem 29.4P Problem 29.5P Problem 29.6P Problem 30.1P Problem 30.2P Problem 30.3P Problem 31.1P Problem 31.2P Problem 31.3P Problem 32.1P Problem 32.2P Problem 32.3P Problem 33.1P Problem 33.2P Problem 33.3P Problem 34.1P Problem 34.2P Problem 34.3P Problem 1.1EP Problem 1.2EP Problem 1.3EP Problem 1.4EP Problem 1.5EP Problem 1.6EP Problem 1.7EP Problem 1.8EP Problem 1.9EP Problem 1.10EP Problem 1.11EP Problem 1.12EP Problem 1.13EP Problem 1.14EP Problem 1.15EP Problem 1.16EP Problem 1.17EP Problem 1.18EP Problem 1.19EP Problem 1.20EP Problem 1.21EP Problem 1.22EP Problem 1.23EP Problem 1.24EP Problem 1.25EP Problem 1.26EP Problem 1.27EP Problem 1.28EP Problem 1.29EP Problem 1.30EP Problem 1.31EP Problem 1.32EP Problem 1.33EP Problem 1.34EP Problem 1.35EP Problem 1.36EP Problem 1.37EP Problem 1.38EP Problem 1.39EP Problem 1.40EP Problem 1.41EP Problem 2.1EP Problem 2.2EP Problem 2.3EP Problem 2.4EP Problem 2.5EP Problem 2.6EP Problem 2.7EP Problem 2.8EP Problem 2.9EP Problem 2.10EP Problem 2.11EP Problem 2.12EP Problem 2.13EP Problem 2.14EP Problem 2.15EP Problem 2.16EP Problem 2.17EP Problem 2.18EP Problem 2.19EP Problem 2.20EP Problem 2.21EP Problem 2.22EP Problem 2.23EP Problem 2.24EP Problem 2.25EP Problem 2.26EP Problem 2.27EP Problem 2.28EP Problem 2.29EP Problem 2.30EP Problem 2.31EP Problem 2.32EP Problem 2.33EP Problem 2.34EP Problem 2.35EP Problem 2.36EP Problem 2.37EP Problem 2.38EP Problem 2.39EP Problem 2.40EP Problem 2.41EP Problem 2.42EP Problem 2.43EP Problem 2.44EP Problem 2.45EP Problem 2.46EP Problem 2.47EP Problem 2.48EP Problem 2.49EP Problem 2.50EP Problem 2.51EP Problem 2.52EP Problem 2.53EP Problem 2.54EP Problem 2.55EP Problem 2.56EP Problem 2.57EP Problem 2.58EP Problem 2.59EP Problem 3.1EP Problem 3.2EP Problem 3.3EP Problem 3.4EP Problem 3.5EP Problem 3.6EP Problem 3.7EP Problem 3.8EP Problem 3.9EP Problem 3.10EP Problem 3.11EP Problem 3.12EP Problem 3.13EP Problem 3.14EP Problem 3.15EP Problem 3.16EP Problem 3.17EP Problem 3.18EP Problem 3.19EP Problem 3.20EP Problem 3.21EP Problem 3.22EP Problem 3.23EP Problem 3.24EP Problem 3.25EP Problem 3.26EP Problem 3.27EP Problem 3.28EP Problem 3.29EP Problem 3.30EP Problem 3.31EP Problem 3.32EP Problem 3.33EP Problem 3.34EP Problem 3.35EP Problem 3.36EP Problem 3.37EP Problem 3.38EP Problem 3.39EP Problem 3.40EP Problem 3.41EP Problem 3.42EP Problem 3.43EP Problem 3.44EP Problem 3.45EP Problem 3.46EP Problem 3.47EP Problem 3.48EP Problem 3.49EP Problem 3.50EP Problem 3.51EP Problem 3.52EP Problem 3.53EP Problem 3.54EP Problem 3.55EP Problem 3.56EP Problem 3.57EP Problem 3.58EP Problem 3.59EP Problem 3.60EP Problem 4.1EP Problem 4.2EP Problem 4.3EP Problem 4.4EP Problem 4.5EP Problem 4.6EP Problem 4.7EP Problem 4.8EP Problem 4.9EP Problem 4.10EP Problem 4.11EP Problem 4.12EP Problem 4.13EP Problem 4.14EP Problem 4.15EP Problem 4.16EP Problem 4.17EP Problem 4.18EP Problem 4.19EP Problem 4.20EP Problem 4.21EP Problem 4.22EP Problem 4.23EP Problem 4.24EP Problem 4.25EP Problem 4.26EP Problem 4.27EP Problem 4.28EP Problem 4.29EP Problem 4.30EP Problem 4.31EP Problem 4.32EP Problem 4.33EP Problem 4.34EP Problem 4.35EP Problem 4.36EP Problem 4.37EP Problem 4.38EP Problem 4.39EP Problem 4.40EP Problem 4.41EP Problem 4.42EP Problem 4.43EP Problem 4.44EP Problem 4.45EP Problem 4.46EP Problem 4.47EP Problem 4.48EP Problem 4.49EP Problem 4.50EP Problem 4.51EP Problem 4.52EP Problem 5.1EP Problem 5.2EP Problem 5.3EP Problem 5.4EP Problem 5.5EP Problem 5.6EP Problem 5.7EP Problem 5.8EP Problem 5.9EP Problem 5.10EP Problem 5.11EP Problem 5.12EP Problem 5.13EP Problem 5.14EP Problem 5.15EP Problem 5.16EP Problem 5.17EP Problem 5.18EP Problem 5.19EP Problem 5.20EP Problem 5.21EP Problem 5.22EP Problem 5.23EP Problem 5.24EP Problem 5.25EP Problem 5.26EP Problem 5.27EP Problem 5.28EP Problem 5.29EP Problem 5.30EP Problem 5.31EP Problem 5.32EP Problem 5.33EP Problem 5.34EP Problem 5.35EP Problem 5.36EP Problem 5.37EP Problem 5.38EP Problem 5.39EP Problem 5.40EP Problem 5.41EP Problem 5.42EP Problem 5.43EP Problem 5.44EP Problem 6.1EP Problem 6.2EP Problem 6.3EP Problem 6.4EP Problem 6.5EP Problem 6.6EP Problem 6.7EP Problem 6.8EP Problem 6.9EP Problem 6.10EP Problem 6.11EP Problem 6.12EP Problem 6.13EP Problem 6.14EP Problem 6.15EP Problem 6.16EP Problem 6.17EP Problem 6.18EP Problem 6.19EP Problem 6.20EP Problem 6.21EP Problem 6.22EP Problem 6.23EP Problem 6.24EP Problem 6.25EP Problem 6.26EP Problem 6.27EP Problem 6.28EP Problem 6.29EP Problem 6.30EP Problem 6.31EP Problem 6.32EP Problem 6.33EP Problem 7.1EP Problem 7.2EP Problem 7.3EP Problem 7.4EP Problem 7.5EP Problem 7.6EP Problem 7.7EP Problem 7.8EP Problem 7.9EP Problem 7.10EP Problem 7.11EP Problem 7.12EP Problem 7.13EP Problem 7.14EP Problem 7.15EP Problem 7.16EP Problem 7.17EP Problem 7.18EP Problem 7.19EP Problem 7.20EP Problem 7.21EP Problem 7.22EP Problem 7.23EP Problem 7.24EP Problem 7.25EP Problem 7.26EP Problem 7.27EP Problem 7.28EP Problem 7.29EP Problem 7.30EP Problem 7.31EP Problem 7.32EP Problem 7.33EP Problem 7.34EP Problem 7.35EP Problem 7.36EP Problem 8.1EP Problem 8.2EP Problem 8.3EP Problem 8.4EP Problem 8.5EP Problem 8.6EP Problem 8.7EP Problem 8.8EP Problem 8.9EP Problem 8.10EP Problem 8.11EP Problem 8.12EP Problem 8.13EP Problem 8.14EP Problem 8.15EP Problem 8.16EP Problem 8.17EP Problem 8.18EP Problem 8.19EP Problem 8.20EP Problem 8.21EP Problem 8.22EP Problem 8.23EP Problem 8.24EP Problem 8.25EP Problem 8.26EP Problem 8.27EP Problem 8.28EP Problem 8.29EP Problem 8.30EP Problem 8.31EP Problem 8.32EP Problem 8.33EP Problem 8.34EP Problem 8.35EP Problem 8.36EP Problem 8.37EP Problem 8.38EP Problem 8.39EP Problem 8.40EP Problem 8.41EP Problem 8.42EP Problem 9.1EP Problem 9.2EP Problem 9.3EP Problem 9.4EP Problem 9.5EP Problem 9.6EP Problem 9.7EP Problem 9.8EP Problem 9.9EP Problem 9.10EP Problem 9.11EP Problem 9.12EP Problem 9.13EP Problem 9.14EP Problem 9.15EP Problem 9.16EP Problem 9.17EP Problem 9.18EP Problem 9.19EP Problem 9.20EP Problem 9.21EP Problem 9.22EP Problem 9.23EP Problem 9.24EP Problem 9.25EP Problem 9.26EP Problem 9.27EP Problem 9.28EP Problem 9.29EP Problem 9.30EP Problem 9.31EP Problem 9.32EP Problem 9.33EP Problem 9.34EP Problem 9.35EP Problem 9.36EP Problem 10.1EP Problem 10.2EP Problem 10.3EP Problem 10.4EP Problem 10.5EP Problem 10.6EP Problem 10.7EP Problem 10.8EP Problem 10.9EP Problem 10.10EP Problem 10.11EP Problem 10.12EP Problem 10.13EP Problem 10.14EP Problem 10.15EP Problem 10.16EP Problem 10.17EP Problem 10.18EP Problem 10.19EP Problem 10.20EP Problem 10.21EP Problem 10.22EP Problem 10.23EP Problem 10.24EP Problem 10.25EP Problem 10.26EP Problem 10.27EP Problem 10.28EP Problem 11.1EP Problem 11.2EP Problem 11.3EP Problem 11.4EP Problem 11.5EP Problem 11.6EP Problem 11.7EP Problem 11.8EP Problem 11.9EP Problem 11.10EP Problem 11.11EP Problem 11.12EP Problem 11.13EP Problem 11.14EP Problem 11.15EP Problem 11.16EP Problem 11.17EP Problem 11.18EP Problem 11.19EP Problem 11.20EP Problem 11.21EP Problem 11.22EP Problem 12.1EP Problem 12.2EP Problem 12.3EP Problem 12.4EP Problem 12.5EP Problem 12.6EP Problem 12.7EP Problem 12.8EP Problem 12.9EP Problem 12.10EP Problem 12.11EP Problem 12.12EP Problem 12.13EP Problem 12.14EP Problem 12.15EP Problem 12.16EP Problem 12.17EP Problem 12.18EP Problem 12.19EP Problem 12.20EP Problem 12.21EP Problem 7.30EP
Related questions
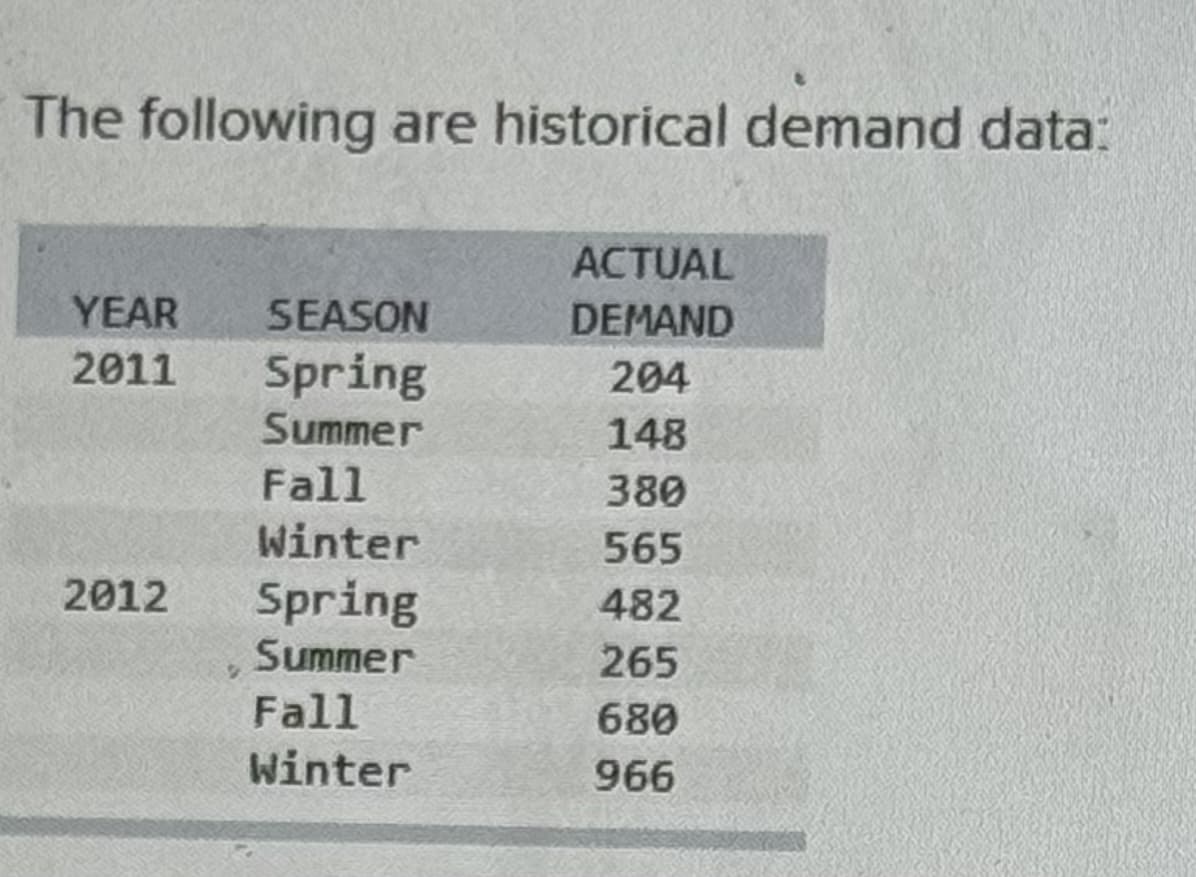
Use regression analysis on deseasonalized demand to forecast demand in summer 2013.
Forecast for summer 2023 ______
Transcribed Image Text: The following are historical demand data:
ACTUAL
YEAR SEASON
DEMAND
2011
Spring
204
Summer
148
Fall
380
Winter
565
2012
Spring
482
Summer
265
Fall
680
Winter
966
Definition Definition Statistical method that estimates the relationship between a dependent variable and one or more independent variables. In regression analysis, dependent variables are called outcome variables and independent variables are called predictors.
Expert Solution
This question has been solved!
Explore an expertly crafted, step-by-step solution for a thorough understanding of key concepts.
Step 1: State the given information.
VIEW
Step 2: Calculate the forecast demand in the summer of 2013
VIEW
Step by step
Solved in 3 steps with 5 images