The following are historical demand data: YEAR 2 years ago last year SEASON Spring Summer Fall Winter Spring Summer Fall Winter ACTUAL DEMAND 203 144 382 565 Forecast for this summer's demand 471 271 686 955 Use regression analysis and seasonal indexes to forecast this summer's demand. Note: Do not round intermediate calculations. Round your answer to the nearest whole number.
The following are historical demand data: YEAR 2 years ago last year SEASON Spring Summer Fall Winter Spring Summer Fall Winter ACTUAL DEMAND 203 144 382 565 Forecast for this summer's demand 471 271 686 955 Use regression analysis and seasonal indexes to forecast this summer's demand. Note: Do not round intermediate calculations. Round your answer to the nearest whole number.

Chapter1: Making Economics Decisions
Section: Chapter Questions
Problem 1QTC

Related questions
Question
Q22 please help me
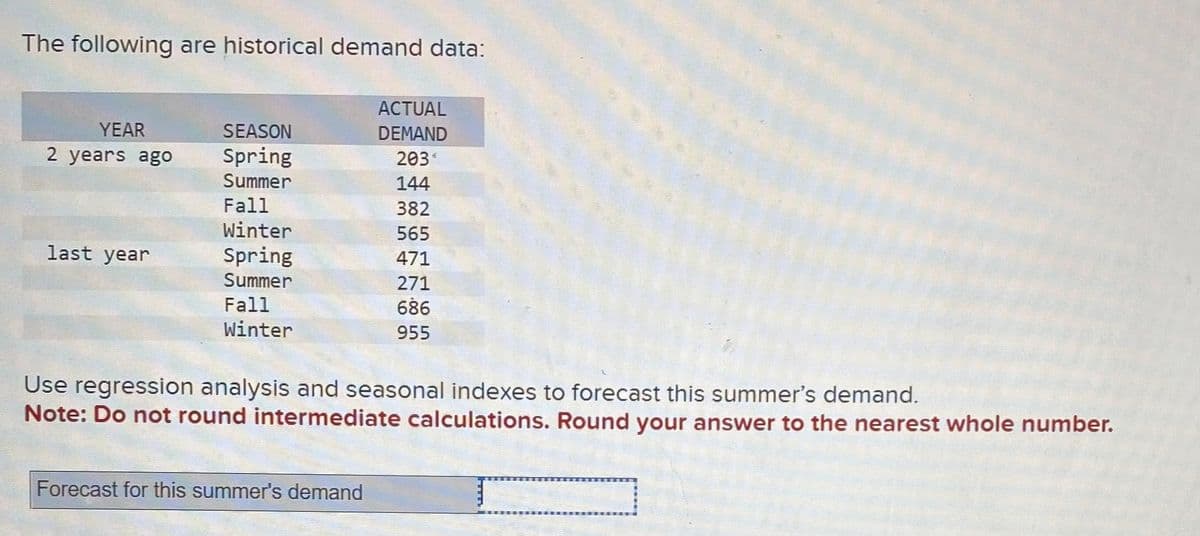
Transcribed Image Text:The following are historical demand data:
YEAR
2 years ago
last year
SEASON
Spring
Summer
Fall
Winter
Spring
Summer
Fall
Winter
ACTUAL
DEMAND
203*
144
382
565
471
271
686
955
Use regression analysis and seasonal indexes to forecast this summer's demand.
Note: Do not round intermediate calculations. Round your answer to the nearest whole number.
Forecast for this summer's demand
Expert Solution
This question has been solved!
Explore an expertly crafted, step-by-step solution for a thorough understanding of key concepts.

Step by step
Solved in 3 steps with 2 images

Knowledge Booster


Learn more about
Need a deep-dive on the concept behind this application? Look no further. Learn more about this topic, economics and related others by exploring similar questions and additional content below.Recommended textbooks for you

Principles of Economics (12th Edition)
Economics
ISBN:
9780134078779
Author:
Karl E. Case, Ray C. Fair, Sharon E. Oster
Publisher:
PEARSON

Engineering Economy (17th Edition)
Economics
ISBN:
9780134870069
Author:
William G. Sullivan, Elin M. Wicks, C. Patrick Koelling
Publisher:
PEARSON
Principles of Economics (12th Edition)
Economics
ISBN:
9780134078779
Author:
Karl E. Case, Ray C. Fair, Sharon E. Oster
Publisher:
PEARSON
Engineering Economy (17th Edition)
Economics
ISBN:
9780134870069
Author:
William G. Sullivan, Elin M. Wicks, C. Patrick Koelling
Publisher:
PEARSON

Principles of Economics (MindTap Course List)
Economics
ISBN:
9781305585126
Author:
N. Gregory Mankiw
Publisher:
Cengage Learning

Managerial Economics: A Problem Solving Approach
Economics
ISBN:
9781337106665
Author:
Luke M. Froeb, Brian T. McCann, Michael R. Ward, Mike Shor
Publisher:
Cengage Learning

Managerial Economics & Business Strategy (Mcgraw-…
Economics
ISBN:
9781259290619
Author:
Michael Baye, Jeff Prince
Publisher:
McGraw-Hill Education