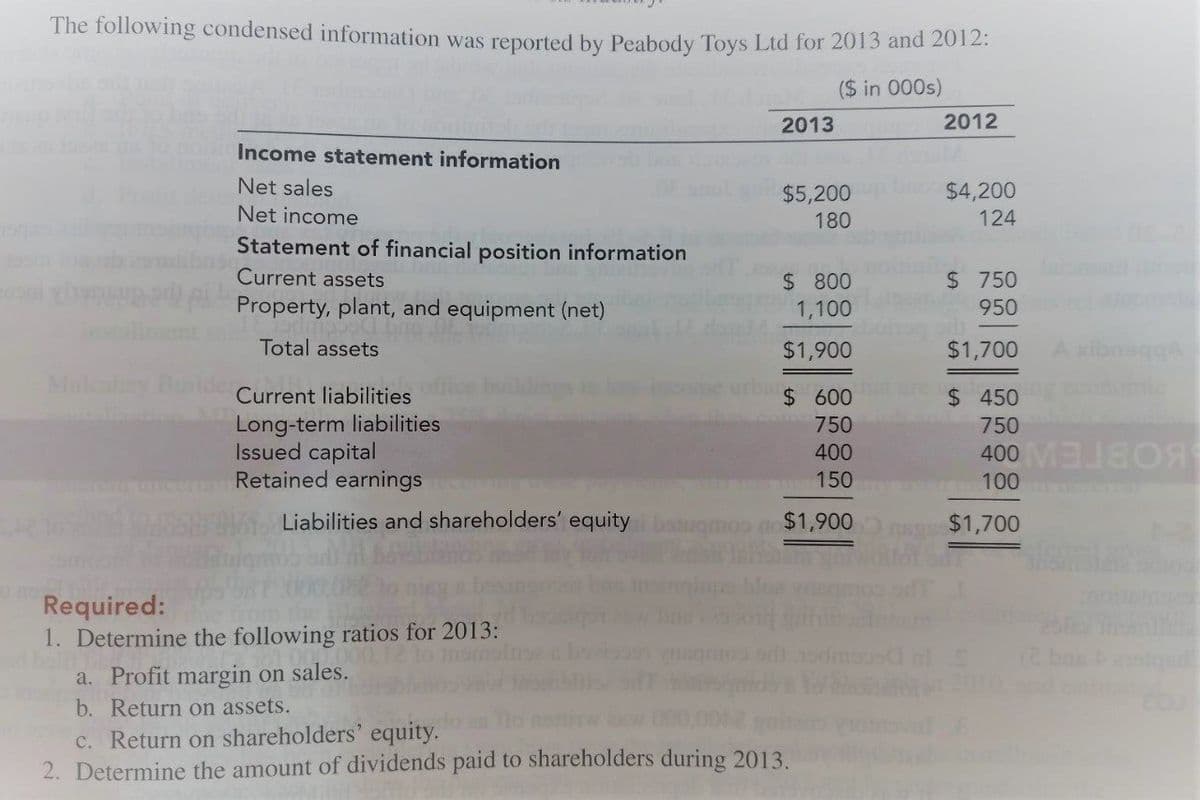
The following condensed information was reported by Peabody Toys Ltd for 2013 and 2012: ($ in 000s) 2013 2012 Income statement information Net sales $5,200 $4,200 Net income 180 124 Statement of financial position information Current assets $ 750 $ 800 1,100 Property, plant, and equipment (net) 950 Total assets $1,900 $1,700 Maleaey Buik $ 450 750 Current liabilities $ 600 750 Long-term liabilities Issued capital Retained earnings 400 400 ME 150 100 Liabilities and shareholders' equity bagmoo do$1,900 $1,700 Required: 1. Determine the following ratios for 2013: (2 bo a. Profit margin on sales. b. Return on assets. c. Return on shareholders' equity. 2. Determine the amount of dividends paid to shareholders during 2013.
Q: The 2017 balance sheet of Dream, Inc., showed current assets of $1,200 and current llabilities of…
A: Opening current assets = $1,200 Opening current liabilities = $820 Opening working capital = Current…
Q: Extract of the Statement of Comprehensive Income for the year ended 31 December 2018 R Revenue…
A:
Q: As of December 31, 2015, Lincolnshire Company had assets of $1,850,000 and liabilities of $570,000.…
A: As per accounting equation, Assets = Liabilities + Owner's Equity Or Owner's Equity =assets -…
Q: Booker Corporation had the following comparative current assets and current liabilities:…
A: We have the following information:
Q: Data for llang-llang Trading Company are given below: 2014 2015 Current Assets 192,375 937,508…
A: Common size analysis and Horizontal analysis are two types of trend analysis, in which financial…
Q: Here are comparative balance sheets for Fateem Company. FATEEM COMPANY Comparative Balance Sheets…
A: The comparative balance sheets for Company are given Required Prepare Cash Flow Statement.
Q: The following information is available from the financial statements of Hornets Corporation for the…
A: Cash flow statement contains three parts :- Cash flow from Operating activities i.e activities…
Q: Instructions Prepare a statement of cash fl ows using the indirect method
A: Net increase in the cash must be equal to the net cash flow generated by operating, investing and…
Q: Condensed balance sheets for Phillips Company and Solina Company on January 1, 2013, are as follows:…
A: PLEASE LIKE THE ANSWER, YOUR RESPONSE MATTERS Books Phillips Company Account Titles and…
Q: Using the information below calculate the ROC of the company Years Revenue ($M) Net…
A: Return on capital is a measure of profitability. It also used in valuation. In simple words ROC…
Q: Sage Hill Inc. had the following balance sheet at December 31, 2016. SAGE HILL INC. BALANCE SHEET…
A: The amount of cash that is available with a company to pay dividends, interest, or to pay creditors…
Q: Comparative balance sheet data for the Veronica Co. at the end of 2013 and 2014 follows:…
A: Workings: calculation of current asset % in 2014 year: (current asset/total asset)*100 =…
Q: Sedibeng Company (Pty) Ltd Extracted the following information from its income statement and Balance…
A: CFS stands for Statement of Cash Flow states the inflows as well as outflows of the cash of the…
Q: The balance sheet for Frankie Co. is shown below: Frankie Co. Balance Sheet At December 31, 2021…
A: Times interest earned ratio is very important ratio which shows ability of the business to meet its…
Q: The 2013 balance sheet for Hallbrook Industries, Inc. is shown below. HALLBROOK INDUSTRIES, INC.…
A: Given the following information: Cash: $200,000 Short-term investments: $150,000 Accounts…
Q: ted income statement, what amount should be reported as consolidated total expenses, including cost…
A:
Q: On December 31, 2015, the net assets of Martinez Manufacturing amounted to $40,000. Net income…
A: Net Assets on Dec 31, 2015 = Net Assets on Jan 1, 2015 + Net Income - Dividend paid + Issued Common…
Q: Help
A: Prepare a statement of cash flows as shown below:
Q: Below are some items that appeared on Joker Plc's restated financial statements, which are prepared…
A: IAS 29 : The figures reported in the financial statements of the company are measured in the…
Q: The balance sheet for Frankie Co. is shown below: Frankie Co. Balance Sheet At December 31, 2021…
A: Quick assets=Cash+Short term investments+Accounts receivable=$150+$200+$300=$650
Q: The condensed financial statements of Soule Company for the years 2013 and 2014 are presented below.…
A: We need the following information: Total Current Assets (2014): £1,350 Total Current Liabilities…
Q: The entry to close Income Summary to Nova, Capital includes * The income statement for the year 2008…
A: solution correct answer is a credit to nova capital for P 3500 The temporary account balance is…
Q: Condensed balance sheets for Phillips Company and Solina Company on January 1, 2013, are as follows:…
A: Journal entries are prepared to record the financial and non-financial transactions of the business.
Q: The balance sheet of 1680 MARKETING Corporation at August 31, 2014 contains the following items:…
A: Liabilities are defined as those amounts which are to be paid by the company to the outside parties.…
Q: Condensed financial data of Pat Metheny Company for 2014 and 2013 are presented below:…
A: Indirect method of cash flow statement involves a reconciliation from profit before tax, adjusting…
Q: The following items are taken from the financial statements of Blue Spruce Company for the year…
A: Blue Spruce Company Income Statement For the period ending December 31, 2022 Sales revenue…
Q: What amount should be reported as noncurrent liabilities on December 31, 2013? a. 340,000 b. 432,000…
A: Working Capital = Current Assets - Current Liabilities Current Liabilities = Current Assets -…
Q: Cullumber Company provides you with the following balance sheet information as of December 31, 2017.…
A: A balance sheet is a financial statement that displays a company's assets, liabilities, and equity.…
Q: During the year 2015, Sadaf Oman Company earned revenues of RO 42,000, had expenses of RO 25,000…
A: Formula: Net Income = Total revenues - Total expenses
Q: 1. The following is a data transaction from PT Colorpop's records as the basis for making a…
A: Comprehensive Income: Comprehensive income for a corporation is the combination of the following…
Q: The statement of financial position of XYZ Company on December 31, 2011 is as follows: Assets…
A: Calculation of fair value of net identifiable assets acquired : Particulars Amount Cash…
Q: The following condensed information was reported by Peabody Toys, Inc., for 2018 and 2017:($ in…
A:
Q: The following are the balance sheet and income statement data of Jowie Corporation Balance Sheet…
A: The Income Statement and Balance Sheet accounts for the year 2008 are given.Evaluate the firm’s…
Q: The comparative balance sheet of Pelican Joe Industries Inc. for December 31, 2016 and 2015, is as…
A: The statement of cash flows records all the sources and use of the cash in the business during a…
Q: The balance sheet of Evergreen Company at June 30, 2012 contains the following items: Assets…
A: “Since you have posted a question with multiple sub-parts, we will solve first three sub-parts for…
Q: The financial statements of ABC Co., appear below: ABC Co. Comparative Balance Sheet December…
A: We have the following information: Balance Sheet Income Statement Cash dividends of $50,000 were…
Q: The following is a partial trial balance for the Green Star Corporation as of December 31, 2016:…
A: Requirement 1: Prepare a single step income statement of Green Star Corporation for the year ended…
Q: Presented below is a condensed version of the comparative balance sheets for Pronghorn Corporation…
A: Free cash flows - Free cash flows are the cash left after cash used for operating activities and…
Trending now
This is a popular solution!
Step by step
Solved in 5 steps
- The comparative balance sheet of Prime Sports Gear, Inc., at December 31, the end of the fiscal year, is as follows: Additional data obtained from the records of Prime Sports Gear are as follows: a. Net income for 2013 was 121,610. b. Depreciation reported on income statement for 2013 was 46,500. c. Purchased 165,000 of new equipment, putting 90,000 cash down and issuing 75,000 of bonds for the balance. d. Old equipment originally costing 19,500, with accumulated depreciation of 7,950, was sold for 8,000. e. Retired 60,000 of bonds. f. Declared cash dividends of 64,000. g. Issued 1,500 shares of common stock at 27 cash per share. Open the file CASHFLOW from the website for this book at cengagebrain.com. First, enter the formulas. Then, complete the worksheet in the manner described next. According to the problem, cash increased from 39,600 to 67,210 during the year. This is a 27,610 increase. To record this increase on the worksheet, move to row 17. Since this is the first account you are analyzing, enter the letter a in column C. Then enter 27610 in column D (a debit since cash increased). This brings the year-end balance (column G) to 67,210, its proper balance. Now move to the bottom part of the statement where you see the categories Operating Activities, Investing Activities, and so on. The credit side of the entry has to be entered here. The proper space for this cash entry is on row 59. Enter the letter a in cell E59 and 27610 in cell F59. Notice the totals at the bottom of the page (row 60) now agree. The next account balance that changed is accounts receivable. It increased by 9,035. To enter this change on the worksheet, enter the letter b in cell C18 and 9035 in cell D18 (again, a debit since accounts receivable increased). This brings the year-end balance in column G to 121,250, its proper balance. The change in accounts receivable balance is an operating activity adjustment (as explained in your textbook). Enter the credit side of this entry in cells E34 and F34, and enter the explanation Increase in accounts receivable in cell A34. Note: Your textbook probably shows Net income as the first item under Operating Activities. We will get to that later. The sequence in which you enter items on this worksheet is not important. All other balance sheet accounts must be analyzed in the same manner, placing appropriate debit or credit entries in the top part of the worksheet to obtain the proper balances in column G, and then entering the second side of the entry in the appropriate row on the bottom part of the worksheet. You should use letter references to identify all entries. Also, you must enter a description of the entry in column A under the appropriate activity category. Although a sequence of analyzing the balance sheet from top to bottom is suggested here, this order is not necessary. As mentioned earlier, your textbook may specify a different sequence. Also, note that some accounts may have both debit and credit adjustments to them. The worksheet is not a substitute for a statement of cash flows, but it does provide you with all the numbers you need to properly prepare one. You will be done with your analysis when: a. The individual account balances at December 31, 2013, as shown on the worksheet (column G) equal those shown in the given problem data. b. The transaction column totals are equal (cells D60 and F60). c. The sum of the operating, investing, and financing activities (cell G59) equals the change in cash (cell D59 or F59). When you are finished, enter your name in cell A1. Save your completed file as CASHFLOW2. Print the worksheet when done. Also print your formulas. Check figure: Total credits at 12/31/2013 (cell G31), 860,460.Twenty metrics of liquidity, solvency, and profitability The comparative financial statements of Automotive Solutions Inc. are as follows. The market price of Automotive Solutions Inc. common stock was $119.70 on December 31, 20Y8 Instructions Return on total assetsTwenty metrics of liquidity, solvency, and profitability The comparative financial statements of Automotive Solutions Inc. are as follows. The market price of Automotive Solutions Inc. common stock was $119.70 on December 31, 20Y8 Instructions Asset turnover
- The following condensed information was reported by Peabody Toys, Inc., for 2018 and 2017:($ in thousands)2018 2017Income statement informationNet sales $5,200 $4,200Net income 180 124Balance sheet informationCurrent assets $ 800 $ 750Property, plant, and equipment (net) 1,100 950Total assets $1,900 $1,700Current liabilities $ 600 $ 450Long-term liabilities 750 750Paid-in capital 400 400Retained earnings 150 100Liabilities and shareholders’ equity $1,900 $1,700Required:1. Determine the following ratios for 2018:a. Profit margin on salesb. Return on assetsc. Return on shareholders’ equity2. Determine the amount of dividends paid to shareholders during 2018.This exercise is based on the Peabody Toys, Inc., data from E 4–27.Below are Financial Positionsstatement for Dawson Co at 31 December 2015 and 31 December 2016 and the Statement of Comprehensive Income for the year ended 31 December 2016. Statement of Comprehensive Income for the year ended 31 December 2016 2016 $ 000 Revenue 900 Cost of sales (550) Gross profit 350 Expenses (245) Finance Costs (9) Profit on sale of equipment 7 Profit before tax 103 Income tax expense (30) Profit for the period 73 Statements of Financial Position at 31 December 2016 2016 2015 $ 000 $ 000 Non-current assets: Property, plant and equipment 528 447 Development costs 110 93 638 540 Current assets Inventory 413 380 Trade Receivables 238 215 Investments 28 - Cash 111 4 790 599 Total Assets 1,428 1,139 Equity and liabilities Ordinary shares of $1 each…Selected comparative statement data for Oriole Company are presented below. All balance sheet data are as of December 31. 20222021Net sales$1,165,000 $1,125,000Cost of goods sold705,000 645,000Interest expense20,000 15,000Net income154,945 145,000Accounts receivable145,000 125,000Inventory105,000 100,000Total assets785,000 700,000Preferred stock (6%)205,000 200,000Total stockholders’ equity635,000 525,000 Compute the following ratios for 2022. (Round answers to 1 decimal place, e.g. 1.8 or 2.5%) (a)Profit marginenter the profit margin in percentages %(b)Asset turnoverenter the asset turnover in times times(c)Return on assetsenter the return on assets in percentages %(d)Return on common stockholders’ equityenter the return on common stockholders' equity in percentages %
- The summarized Statement of Financial Position of P Bhd. and S Bhd. as at 31December 2016 is shown below: P Bhd.RM ‘000 S Bhd.RM ‘000 Non – current assetsProperty, plant &equipment 720 160 Investment in SBhd. 185 Current assets 175 951,080 255Share capital 400 100Retained earnings b/f 500 60Retained earnings –current year 60 12Current liabilities 120 831,080 255 Additional information:(i) P Bhd. acquired 60% of S Bhd. on the date of acquisition (1/7/2016) (ii) P Bhd. adopts the proportional net assets value method in valuation of non-controlling interest. (iii) At date of acquisition, fair value of NCI was RM 50,000Prepare the Consolidated Statement of Financial Position as at 31/12/2016.The condensed financial statements of Ivanhoe Company for the years 2016 and 2017 are presented as follows. (Amounts in thousands.) IVANHOE COMPANYBalance SheetsDecember 3120172016Current assets Cash and cash equivalents$330$360 Accounts receivable (net)640570 Inventory530460 Prepaid expenses120160 Total current assets1,6201,550Investments180180Property, plant, and equipment (net)420380Intangibles and other assets530510 Total assets$2,750$2,620Current liabilities$1,070$960Long-term liabilities480450Stockholders’ equity—common1,2001,210 Total liabilities and stockholders’ equity$2,750$2,620 IVANHOE COMPANYIncome StatementsFor the Year Ended December 3120172016Sales revenue$3,870$3,530Costs and expenses Cost of goods sold1,1251,060 Selling & administrative expenses2,4002,330 Interest expense2520 Total costs and expenses3,5503,410Income before income taxes320120Income tax expense9636Net income$ 224$ 84 Compute the following ratios for 2017 and 2016.…The condensed financial statements of Ivanhoe Company for the years 2016 and 2017 are presented as follows. (Amounts in thousands.) IVANHOE COMPANYBalance SheetsDecember 3120172016Current assets Cash and cash equivalents$330$360 Accounts receivable (net)640570 Inventory530460 Prepaid expenses120160 Total current assets1,6201,550Investments180180Property, plant, and equipment (net)420380Intangibles and other assets530510 Total assets$2,750$2,620Current liabilities$1,070$960Long-term liabilities480450Stockholders’ equity—common1,2001,210 Total liabilities and stockholders’ equity$2,750$2,620 IVANHOE COMPANYIncome StatementsFor the Year Ended December 3120172016Sales revenue$3,870$3,530Costs and expenses Cost of goods sold1,1251,060 Selling & administrative expenses2,4002,330 Interest expense2520 Total costs and expenses3,5503,410Income before income taxes320120Income tax expense9636Net income$ 224$ 84 Compute the following ratios for 2017 and 2016.…
- The following balance sheet is for the Ballyhoo Company forfiscal year-end 2014. Please fill in all missingdata. Assets Liabilities and Equity_____________ Cash $4,300 Accountspayable $2,340 Accounts receivable _____ Notespayable 4,300 Inventories 8,200 Accruals 1,620 Total current assets$14,300 Total currentliabs. _____ Gross plant and equip._____ Long-termbonds _____ Less: accum depr. 5,630 Totaldebt $13,100 Net plant and equip. _____ Common stock(100 shares) 6,300 Retainedearnings _____ Total Common equity $13,800 TotalAssets _______ Preferred Stock _____ Total liabs &equity $30,000Cara Company provided the following information: 1/1/2013 12/31/2013Current assets 240,000 ?Property, plant and equipment 1,600,000 1,700,000Current liabilities ? 130,000Noncurrent liabilities 580,000 ?All assets and liabilities of the entity are reported at year-end. Working capitalof P92,000 remained unchanged from 2012 to 2013. Net income in 2013 wasP64,000. No dividends were declared during 2013 and there were no other changesin owner’s equity. What amount should be reported as noncurrent liabilities onDecember 31, 2013?a. 340,000b. 432,000c. 580,000d. 616,000BE11-10 In its 2011 annual report, Campbell Soup Company reports beginning-of-the-year total assets of $6,276 million, end-of-the-year total assets of $6,862 million, total sales of $7,719 million, and net income of $805 million. (a) Compute Campbell's asset turnover. (b) Compute Campbell's profit margin on sales. (c) Compute Campbell's return on assets using (1) asset turnover and profit margin and (2) net income.