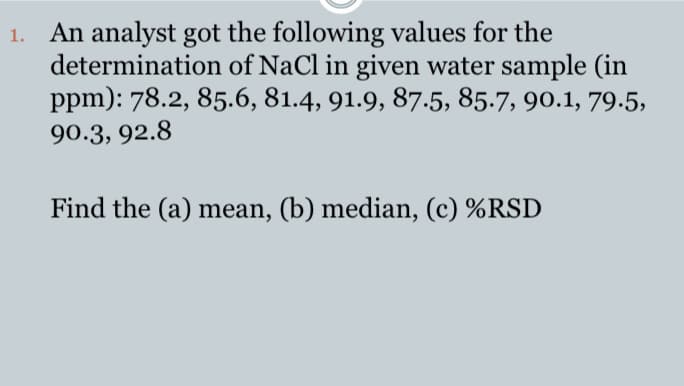
1. An analyst got the following values for the determination of NaCl in given water sample (in ppm): 78.2, 85.6, 81.4, 91.9, 87.5, 85.7, 90.1, 79.5, 90.3, 92.8 Find the (a) mean, (b) median, (c) %RSD
Q: Consider the following set of ungrouped sample data. Answer parts A through D. 3 4 3 3 0 2 1 6 5 7 0…
A: Given data 3,3,4,3,0,2,1,6,5,7 n=10
Q: Calculate the mean deviation from the mean for the following data : Size : 2 6 8 10 12 14 16 ency :…
A: We have given that data Mean = sum of all observations/total number of observations.
Q: The file contains the amount that a sample of nine customers spent for lunch ($) at a fast-food…
A:
Q: Given the following observations from a sample, calculate the mean, the median, and the mode. (Round…
A: Calculate Mean, Median, Mode from the following data15,19,19,12,11Mean…
Q: For the following data obtain (i) mean, (ii) median, (iii) mean deviation from median, and (iv) the…
A:
Q: - Find the mean, median, and mode for the following data. Round noninteger values to the nearest…
A:
Q: Given the following observations from a sample, calculate the mean, the median, and the mode. (Round…
A:
Q: 3 13 Calculate the mean deviation (from median) from the following data :- Class interval Frequency…
A:
Q: Calculate mean deviation from mean and median for the following data : Comba 500 100 150 200 250 360…
A: Given : Sample 100 150 200 250 360 490 500 600 671
Q: Past records suggest that the mean annual income, μ1 , of teachers in state of California is less…
A: State the hypotheses. That is, there is no sufficient evidence to reject the claim that the mean…
Q: Find the mean and the population standard deviation of the race times in the following table. 49.4…
A:
Q: 14. Calculate S.D. from the following data. Values : 110, 115, 120, 125, 130, 135, 140, 145, 150,…
A:
Q: for the following data approximate the mean number of unused vacation days at the end of the year?…
A: Days midpoint( xi) frequency(fi) xifi 1-3 2 28 56 4-6 5 27 135 7-9 8 1 8 10-12 11 5 55…
Q: Consider the following data representing the price of laptop computers (in dollars). 1465, 1151,…
A: Please see the answer below.
Q: Given the following data, compute for the mean, median and mode. A. Scores of grade 10 students in a…
A: Given the following data, 12,17,18,2,19,20,15,22,16,8,20,23,11,25,9 Formula for Mean is, Mean=Sum of…
Q: The following data set represents the number of new computer accounts registered during ten…
A: Calculate Mean, Median, Mode from the following data43,37,50,51,58,105,52,45,45,10
Q: The Tampa Bay (Florida) Area Chamber of Commerce wanted to know whether the mean weekly salary of…
A: (1) Determine the tail of the test. The tail of the test is determined below as follows: From…
Q: For the following Grouped Frequency Data Table (GFDT) answer the questions below. Lower Class…
A: Class interval Frequency Cumulative Frequency 30-34 10 10 35-39 9 19 40-44 4 23 45-49 10 33…
Q: The following are the number of accidents that occurred in June of 1998 at eighteen selected…
A: Note: Since you have posted a question with multiple subparts, we will solve the first three…
Q: he following data represent the number of people aged 25 to 64 years covered by health insurance…
A:
Q: Given the following data: 76,38,64, 19,25,57,88,64,87, 13, 19,86,90, 43,56,65 80, 55,…
A: Let us have a larger number of individual observations. There are two types of frequency…
Q: Find the mean,mode,median ,skewness and variances and standart deviations of the following data set…
A: Mean : The mean of a data set is the sum of the terms divided by the total number of terms. Using…
Q: 1. The following questions refer to the following data: 2, -1, 0, 2. What is the sample mean of the…
A:
Q: 7. Compute mean deviation from mean and median from the following data : Height in cms 158 159 160…
A: Given data is Heights in cms 158 159 160 161 162 163 164 165 166 No.of persons 15 20 32 35 33…
Q: 1. Find the mean, median and variance for the following data set. 15, 10, 13, 7, 9, 8, 21, 9, 14, 8
A: Provided data is: 15, 10, 13, 7, 9, 8, 21, 9, 14, 8. Mean is sum of observations divided by number…
Q: 8. Which of the following measures of central tendencies is most appropriate if the data can be…
A: Mean: The arithmetic mean (also called the mean) is the most commonly used measure of central…
Q: Please, find the Arthematic Mean, Geomatric Mean, Harmonic Mean, Mode & Median of the given data.…
A: It is a single value within the range of data which represents a group of individuals values in a…
Q: The following data represent the number of people aged 25 to 64 years covered by health insurance…
A: The provided frequency distribution is: Age Number 25-34 20.8 35-44 31.9 45-54…
Q: Past records suggest that the mean annual income, u, of teachers in state of Utah is greater than or…
A: State the hypotheses. Determine the type of test statistic used. The type of test statistic…
Q: Ten patients at a doctor's surgery wait for the following lengths of times to see their doctor. 5…
A: Arranging the data in ascending order: 5, 8, 9, 11, 12, 15, 16, 17, 22, 55 n=10
Q: 4. Given the following distribution: Scores Frequency 145 - 154 7 135 - 144 13 125- 134 28 115 - 124…
A: Given:
Q: Find the standard deviation for the group of data items 8,9,10,11,12
A: We have given the following data 8,9,10,11,12 And we have to find out standard deviation.
Q: The Tampa Bay (Florida) Area Chamber of Commerce wanted to know whether the mean weekly salary of…
A: Null Hypothesis: H0: The mean weekly salary of nurses is not higher than the school teachers.…
Q: 15. Calculate the median from the following data:
A: Here given grouped frequency distribution of weight of apples
Q: 1-) For the following data, please compute: X- [1,2.2, 3,3, 3, 4, 4, 4, 4, 5, 5,5, 6,6, 6, 7, 7,…
A: Summary statistics are used for an explanatory data analysis and get a brief idea about the data.
Q: ppose that the number of speed-related crash fatalities for the 15 U.S. states that had the highest…
A: Given Data, State Speeding-RelatedTraffic Fatalities Texas 1246 California 915 Pennsylvania…
Q: The Tampa Bay (Florida) Area Chamber of Commerce wanted to know whether the mean weekly salary of…
A: It is given that:
Q: Past records suggest that the mean annual income, u, of teachers in state of New York is less than…
A: Let X : annual income of 15 teachers from New york Y : annual income of 15 teachers from Illinois :…
Q: Calculate the mean deviation and its coefficient both from mean and median for the following. Marks:…
A:
Q: Consider the following data set: 1, 7, 7, 2, 3, 5, 13, 17, 18, 12, 9, 15, 20, 20, 22, 25 f. Find the…
A:
Q: Given the following data for the years of experience for a sample of 10 employees in Leon’s…
A:
Q: The following data represent the number of people aged 25 to 64 years covered by health insurance…
A: The following table gives the data set with the required calculations:
Q: Consider the following data representing the price of plasma televisions (in dollars). 1260, 1355,…
A: Frequency is the measure of count. It helps to tabulate the larger number of individuals. It can be…
Q: Past records suggest that the mean annual income, μ1 , of teachers in state of Utah is greater…
A: The sample means of annual income of teachers in Utah and in Oregon are, The null hypothesis is,…
Q: 2) The following data represent the difference in scores between the winning and losing teams in a…
A: The question is based on frequency dist. of grouped data. Given : Point Difference No. of Bowl…
Q: The following data represent the number of people aged 25 to 64 years covered by health insurance…
A:
Q: What is the percentile for your 10th data point? (when they are arranged in order) Number of Frogs…
A: Percentile are the values of variates from we form the cummulative frequencies are…
Q: 1-) For the following data, please compute: X= [1 ,2, 2, 3, 3, 3, 4, 4, 4, 4, 5, 5, 5, 6, 6, 6, 7,7,…
A: A) We will first insert all the data into excel and from the excel functions we can get mean ,median…
Step by step
Solved in 2 steps