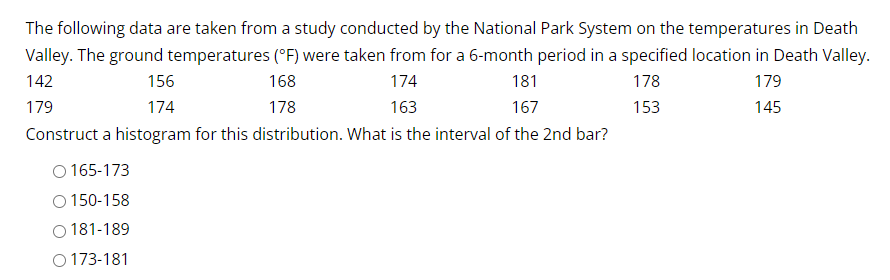
The following data are taken from a study conducted by the National Park System on the temperatures in Death Valley. The ground temperatures (°F) were taken from for a 6-month period in a specified location in Death Valley. 174 142 181 178 179 168 178 163 167 153 145 179 Construct a histogram for this distribution. What is the interval of the 2nd bar? O165-173 O 150-158 O 181-189 O173-181 156 174
The following data are taken from a study conducted by the National Park System on the temperatures in Death Valley. The ground temperatures (°F) were taken from for a 6-month period in a specified location in Death Valley. 174 142 181 178 179 168 178 163 167 153 145 179 Construct a histogram for this distribution. What is the interval of the 2nd bar? O165-173 O 150-158 O 181-189 O173-181 156 174

Mathematics For Machine Technology
8th Edition
ISBN:9781337798310
Author:Peterson, John.
Publisher:Peterson, John.
Chapter29: Tolerance, Clearance, And Interference
Section: Chapter Questions
Problem 16A: Spacers are manufactured to the mean dimension and tolerance shown in Figure 29-12. An inspector...

Related questions
Question
17
Transcribed Image Text:The following data are taken from a study conducted by the National Park System on the temperatures in Death
Valley. The ground temperatures (°F) were taken from for a 6-month period in a specified location in Death Valley.
181
142
174
178
179
156
174
168
178
179
163
167
153
145
Construct a histogram for this distribution. What is the interval of the 2nd bar?
O165-173
O 150-158
O 181-189
O173-181
Expert Solution
This question has been solved!
Explore an expertly crafted, step-by-step solution for a thorough understanding of key concepts.

Step by step
Solved in 2 steps with 2 images

Recommended textbooks for you
Mathematics For Machine Technology
Advanced Math
ISBN:
9781337798310
Author:
Peterson, John.
Publisher:
Cengage Learning,
Mathematics For Machine Technology
Advanced Math
ISBN:
9781337798310
Author:
Peterson, John.
Publisher:
Cengage Learning,