The following data lists the ages of a random selection of actresses when they won an award in the category of Best Actress, along with the ages of actors when they won in the category of Best Actor. The ages are matched according to the year that the awards were presented. Complete parts (a) and (b) below. Actress (years) 31 Actor (years) 25 33 31 34 29 23 37 31 32 D 61 33 34 42 27 35 50 37 36 44 a. Use the sample data with a 0.05 significance level to test the claim that for the population of ages of Best Actresses and Best Actors, the differences have a mean less than 0 (indicating that the Best Actresses are generally younger than Best Actors). In this example, Ha is the mean value of the differences d for the population of all pairs of data, where each individual difference d is defined as the actress's age minus the actor's age. What are the null and alternative hypotheses for the hypothesis test? Ho: >1 year(s) H H 1 year(s) (Type integers or decimals. Do not round.) Identify the test statistic. t-1 (Round to two decimal places as needed.) Identify the P-value. P-value 1 (Round to three decimal places as needed.) What is the conclusion based on the hypothesis test? Since the P-value is greater than the significance level, reject the null hypothesis. There is sufficient evidence to support the claim that actre
The following data lists the ages of a random selection of actresses when they won an award in the category of Best Actress, along with the ages of actors when they won in the category of Best Actor. The ages are matched according to the year that the awards were presented. Complete parts (a) and (b) below. Actress (years) 31 Actor (years) 25 33 31 34 29 23 37 31 32 D 61 33 34 42 27 35 50 37 36 44 a. Use the sample data with a 0.05 significance level to test the claim that for the population of ages of Best Actresses and Best Actors, the differences have a mean less than 0 (indicating that the Best Actresses are generally younger than Best Actors). In this example, Ha is the mean value of the differences d for the population of all pairs of data, where each individual difference d is defined as the actress's age minus the actor's age. What are the null and alternative hypotheses for the hypothesis test? Ho: >1 year(s) H H 1 year(s) (Type integers or decimals. Do not round.) Identify the test statistic. t-1 (Round to two decimal places as needed.) Identify the P-value. P-value 1 (Round to three decimal places as needed.) What is the conclusion based on the hypothesis test? Since the P-value is greater than the significance level, reject the null hypothesis. There is sufficient evidence to support the claim that actre

Glencoe Algebra 1, Student Edition, 9780079039897, 0079039898, 2018
18th Edition
ISBN:9780079039897
Author:Carter
Publisher:Carter
Chapter10: Statistics
Section10.4: Distributions Of Data
Problem 19PFA

Related questions
Question
Please help I need in an hour Thankyou so much
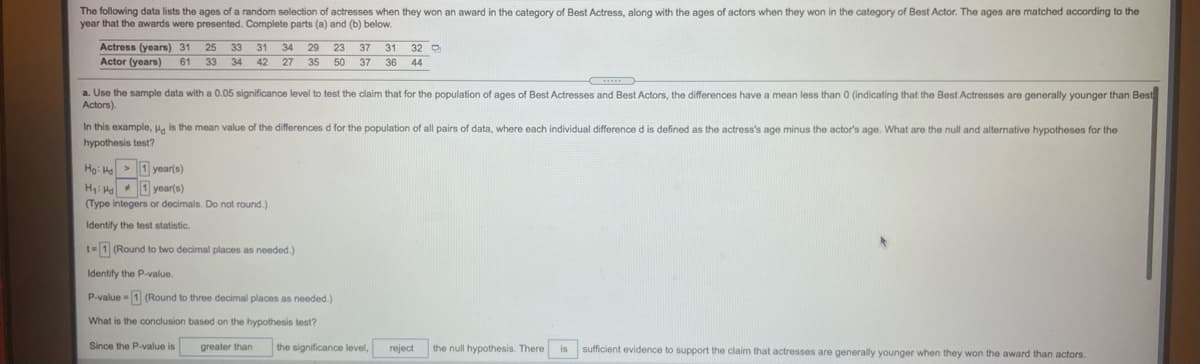
Transcribed Image Text:The following data lists the ages of a random selection of actresses when they won an award in the category of Best Actress, along with the ages of actors when they won in the category of Best Actor. The ages are matched according to the
year that the awards were presented. Complete parts (a) and (b) below.
Actress (years) 31
Actor (years)
25
33
31
34
29
23
37
31
32 D
61
33
34
42
27 35 50 37 36
44
a. Use the sample data with a 0.05 significance level to test the claim that for the population of ages of Best Actresses and Best Actors, the differences have a mean less than 0 (indicating that the Best Actresses are generally younger than Best
Actors).
In this example, Ha is the mean value of the differences d for the population of all pairs of data, where each individual difference d is defined as the actress's age minus the actor's age. What are the null and alternative hypotheses for the
hypothesis test?
Họ: He > 1 year(s)
H: H 1 year(s)
(Type integers or decimals. Do not round.)
Identify the test statistic.
t=1 (Round to two decimal places as needed.)
Identify the P-value.
P-value - 1 (Round to three decimal places as needed.)
What is the conclusion based on the hypothesis test?
Since the P-value is
greater than
the significance level,
reject
the null hypothesis. There is sufficient evidence
support the claim that actresses are generally younger when they won the award than actors.
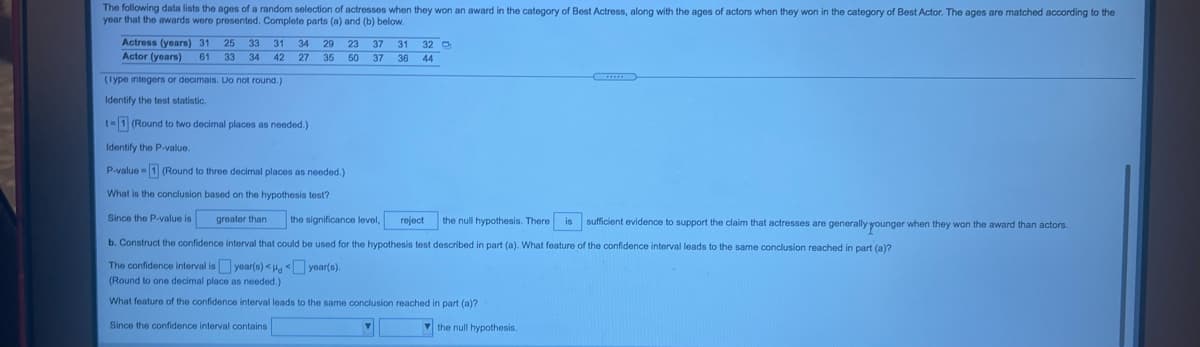
Transcribed Image Text:The following data lists the ages of a random selection of actresses when they won an award in the category of Best Actress, along with the ages of actors when they won in the category of Best Actor. The ages are matched according to the
year that the awards were presented. Complete parts (a) and (b) below.
34 29 23 37
27 35 50 37 36 44
Actress (years) 31
25
33 31
31 32 O
Actor (years)
61 33 34 42
(Iype integers or decimals. Do not round.)
Identify the test statistic.
t-1 (Round to two decimal places as needed.)
Identify the P-value.
P-value - 1 (Round to three decimal places as needed.)
What is the conclusion based on the hypothesis test?
Since the P-value is
greater than
the significance level,
reject
the null hypothesis. There is
sufficient evidence to support the claim that actresses are generally younger when they won the award than actors.
b. Construct the confidence interval that could be used for the hypothesis test described in part (a). What feature of the confidence interval leads to the same conclusion reached in part (a)?
The confidence interval is year(s) <Hg year(s).
(Round to one decimal place as needed.)
What feature of the confidence interval leads to the same conclusion reached in part (a)?
Since the confidence interval contains
v the null hypothesis.
Expert Solution
This question has been solved!
Explore an expertly crafted, step-by-step solution for a thorough understanding of key concepts.

This is a popular solution!

Trending now
This is a popular solution!

Step by step
Solved in 3 steps with 6 images

Recommended textbooks for you
Glencoe Algebra 1, Student Edition, 9780079039897…
Algebra
ISBN:
9780079039897
Author:
Carter
Publisher:
McGraw Hill
Glencoe Algebra 1, Student Edition, 9780079039897…
Algebra
ISBN:
9780079039897
Author:
Carter
Publisher:
McGraw Hill