The following data represent salaries, in thousands of dollars, for employees of a small company. Notice the data have been sorted in increasing order. 54 55 55 57 57 59 60 65 65 65 66 68 68 69 69 70 7o 70 75 75 75 75 77 82 82 82 88 89 89 91 91 97 98 98 98 280 n USE SALT (a) Make a histogram using the class boundaries 53.5, 99.5, 145.5, 191.5, 237.5, 283.5. 40 36 40 35 35 36 32 28 20 20 4 1 53.5 99.5 145.5 191.5 237.5 283,5 53,5 99.5 145,5 191.5 237,5 283.5 Salaries Salaries 40 36 32 53.5 99.5 20 16 4 283.5 283,5 53.5 99,5 145.5 191.5 237.5 283.5 53.5 99.5 145,5 191.5 237.5 283.5 Frequency Frequency (b) Look at the last data value. Does it appear to be an outlier? Could this be the owner's salary? O Yes, it is an outlier and it is likely the owner's salary. O Yes, it is an outlier, but it is not likely the owner's salary. O No, it is not an outlier, but it is likely the owner's salary. O No, it is not an outlier and it is not likely the owner's salary. (c) Eliminate the high salary of 280 thousand dollars. Make a new histogram using the class boundaries 53.5, 62.5, 71.5, 80.5, 89.5, 98.5. 12 71.5 12 11 10 10 8 62.5 89.5 98.5 6 6 80.5 53.5 62.5 71.5 80.5 89.5 98.5 53.5 62.5 71.5 80.5 89.5 98.5 Frequency Salaries 12 12 10 9 10 89.5 8 71.5 8 62.5 98.5 80.5 53.5 62.5 71.5 80.5 89.5 98.5 53,5 62.5 71.5 80.5 89.5 98.5 Salaries Frequency Salaries Frequency Salaries Frequency
The following data represent salaries, in thousands of dollars, for employees of a small company. Notice the data have been sorted in increasing order. 54 55 55 57 57 59 60 65 65 65 66 68 68 69 69 70 7o 70 75 75 75 75 77 82 82 82 88 89 89 91 91 97 98 98 98 280 n USE SALT (a) Make a histogram using the class boundaries 53.5, 99.5, 145.5, 191.5, 237.5, 283.5. 40 36 40 35 35 36 32 28 20 20 4 1 53.5 99.5 145.5 191.5 237.5 283,5 53,5 99.5 145,5 191.5 237,5 283.5 Salaries Salaries 40 36 32 53.5 99.5 20 16 4 283.5 283,5 53.5 99,5 145.5 191.5 237.5 283.5 53.5 99.5 145,5 191.5 237.5 283.5 Frequency Frequency (b) Look at the last data value. Does it appear to be an outlier? Could this be the owner's salary? O Yes, it is an outlier and it is likely the owner's salary. O Yes, it is an outlier, but it is not likely the owner's salary. O No, it is not an outlier, but it is likely the owner's salary. O No, it is not an outlier and it is not likely the owner's salary. (c) Eliminate the high salary of 280 thousand dollars. Make a new histogram using the class boundaries 53.5, 62.5, 71.5, 80.5, 89.5, 98.5. 12 71.5 12 11 10 10 8 62.5 89.5 98.5 6 6 80.5 53.5 62.5 71.5 80.5 89.5 98.5 53.5 62.5 71.5 80.5 89.5 98.5 Frequency Salaries 12 12 10 9 10 89.5 8 71.5 8 62.5 98.5 80.5 53.5 62.5 71.5 80.5 89.5 98.5 53,5 62.5 71.5 80.5 89.5 98.5 Salaries Frequency Salaries Frequency Salaries Frequency

MATLAB: An Introduction with Applications
6th Edition
ISBN:9781119256830
Author:Amos Gilat
Publisher:Amos Gilat
Chapter1: Starting With Matlab
Section: Chapter Questions
Problem 1P

Related questions
Question
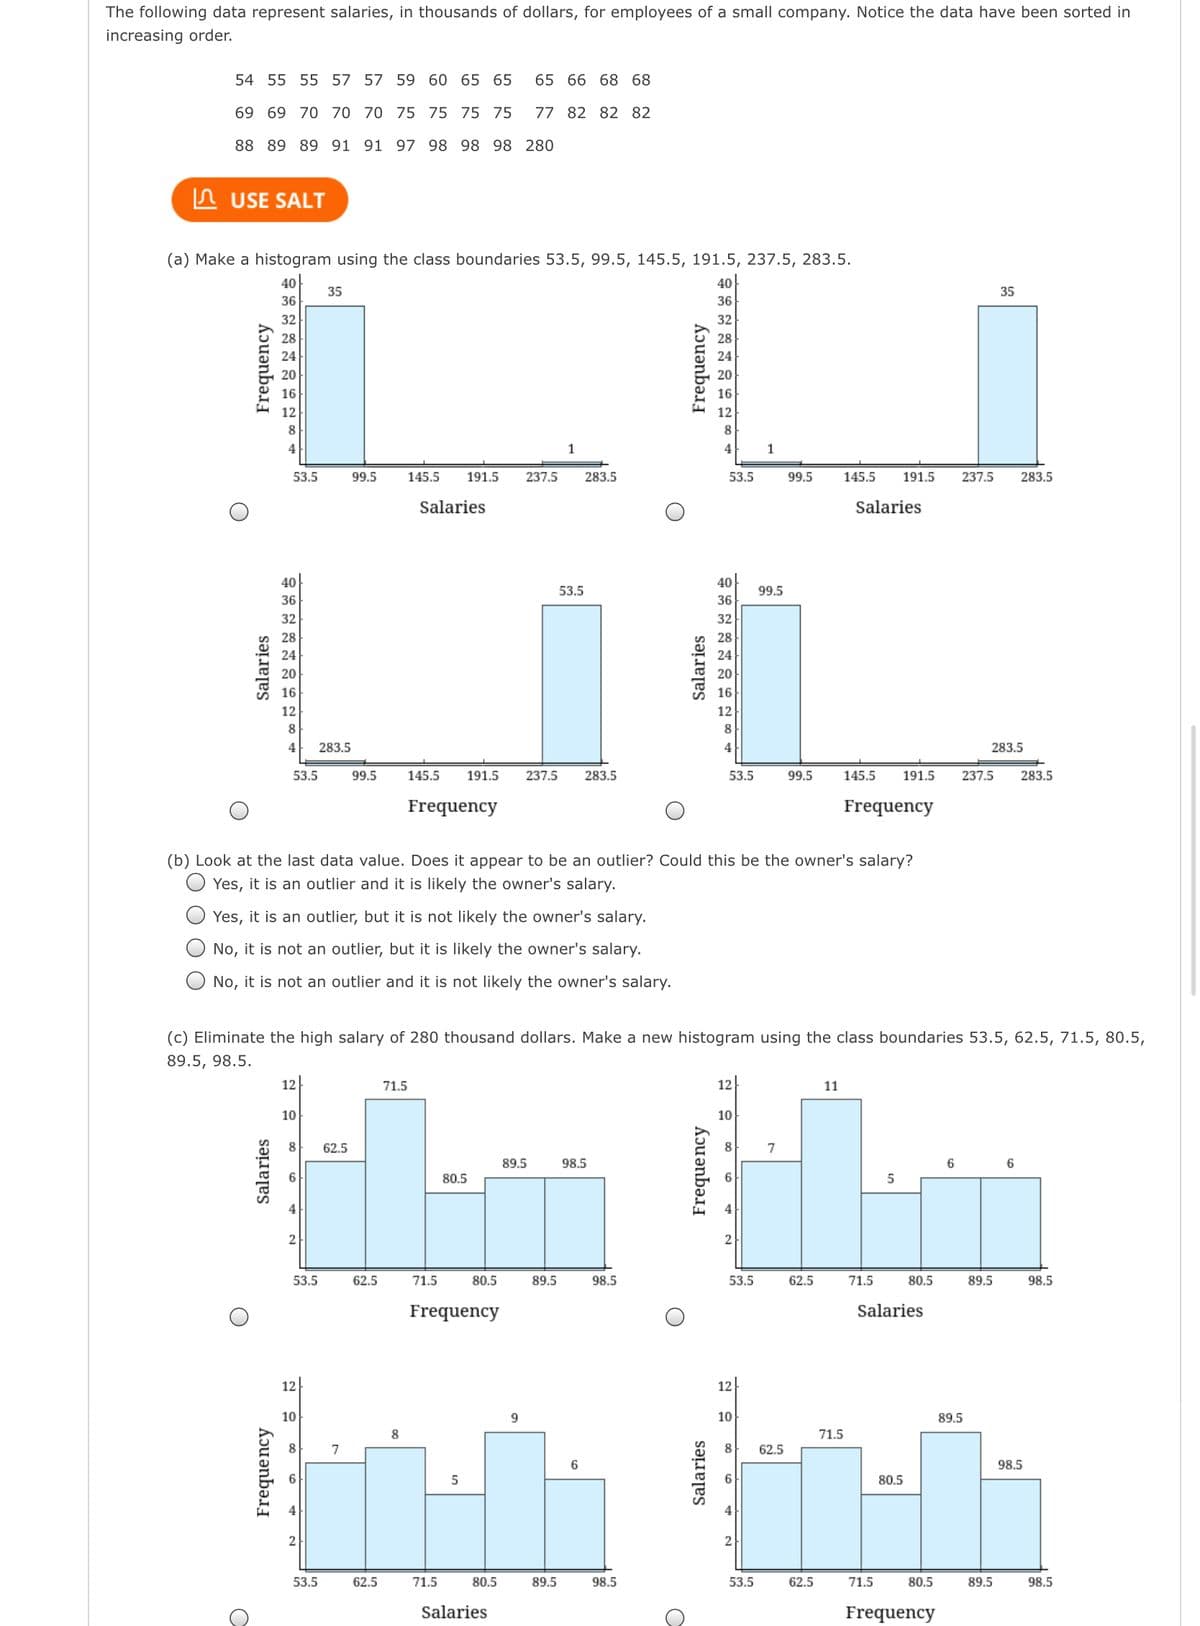
Transcribed Image Text:The following data represent salaries, in thousands of dollars, for employees of a small company. Notice the data have been sorted in
increasing order.
54 55 55 57 57 59 60 65 65
65 66 68 68
69 69 70 70 70 75 75 75 75
77 82 82 82
88 89 89 91 91 97 98 98 98 280
In USE SALT
(a) Make a histogram using the class boundaries 53.5, 99.5, 145.5, 191.5, 237.5, 283.5.
40
40
35
35
36
36
32
32
28
24
20
20
16
16
12
12
8.
8
4
1
53.5
99.5
145.5
191.5
237.5
283.5
53.5
99.5
145.5
191.5
237.5
283.5
Salaries
Salaries
40
40
53.5
99.5
36
36
32
32
28
28
24
24
20
20
16
16
12
12
8
8
4
283.5
4
283.5
53.5
99.5
145.5
191.5
237.5
283.5
53.5
99.5
145.5
191.5
237.5
283.5
Frequency
Frequency
(b) Look at the last data value. Does it appear to be an outlier? Could this be the owner's salary?
Yes, it is an outlier and it is likely the owner's salary.
Yes, it is an outlier, but it is not likely the owner's salary.
No, it is not an outlier, but it is likely the owner's salary.
No, it is not an outlier and it is not likely the owner's salary.
(c) Eliminate the high salary of 280 thousand dollars. Make a new histogram using the class boundaries 53.5, 62.5, 71.5, 80.5,
89.5, 98.5.
12
71.5
12
11
10
10
8
62.5
8
7
89.5
98.5
6
80.5
53.5
62.5
71.5
80.5
89.5
98.5
53.5
62.5
71.5
80.5
89.5
98.5
Frequency
Salaries
12
12
10
9.
10
89.5
8
71.5
8.
7
8.
62.5
6
98.5
80.5
2
2
53.5
62.5
71.5
80.5
89.5
98.5
53.5
62.5
71.5
80.5
89.5
98.5
Salaries
Frequency
Salaries
Salaries
Frequency
Frequency
Salaries
Frequency
Expert Solution
This question has been solved!
Explore an expertly crafted, step-by-step solution for a thorough understanding of key concepts.

This is a popular solution!

Trending now
This is a popular solution!

Step by step
Solved in 4 steps with 2 images

Recommended textbooks for you
MATLAB: An Introduction with Applications
Statistics
ISBN:
9781119256830
Author:
Amos Gilat
Publisher:
John Wiley & Sons Inc

Probability and Statistics for Engineering and th…
Statistics
ISBN:
9781305251809
Author:
Jay L. Devore
Publisher:
Cengage Learning

Statistics for The Behavioral Sciences (MindTap C…
Statistics
ISBN:
9781305504912
Author:
Frederick J Gravetter, Larry B. Wallnau
Publisher:
Cengage Learning
MATLAB: An Introduction with Applications
Statistics
ISBN:
9781119256830
Author:
Amos Gilat
Publisher:
John Wiley & Sons Inc
Probability and Statistics for Engineering and th…
Statistics
ISBN:
9781305251809
Author:
Jay L. Devore
Publisher:
Cengage Learning
Statistics for The Behavioral Sciences (MindTap C…
Statistics
ISBN:
9781305504912
Author:
Frederick J Gravetter, Larry B. Wallnau
Publisher:
Cengage Learning

Elementary Statistics: Picturing the World (7th E…
Statistics
ISBN:
9780134683416
Author:
Ron Larson, Betsy Farber
Publisher:
PEARSON

The Basic Practice of Statistics
Statistics
ISBN:
9781319042578
Author:
David S. Moore, William I. Notz, Michael A. Fligner
Publisher:
W. H. Freeman

Introduction to the Practice of Statistics
Statistics
ISBN:
9781319013387
Author:
David S. Moore, George P. McCabe, Bruce A. Craig
Publisher:
W. H. Freeman