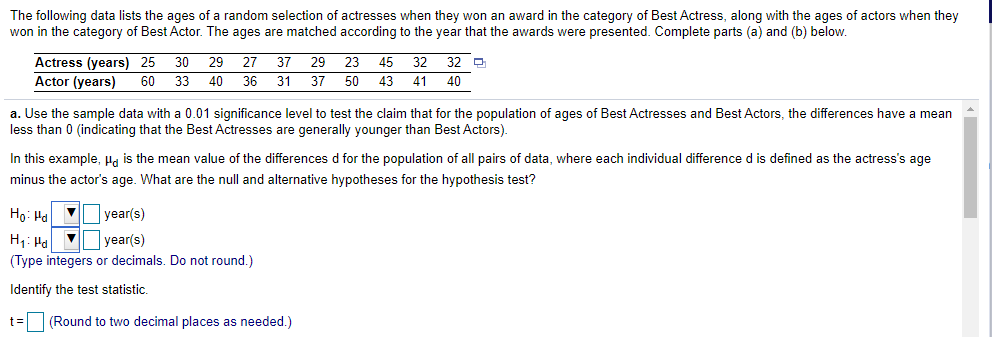
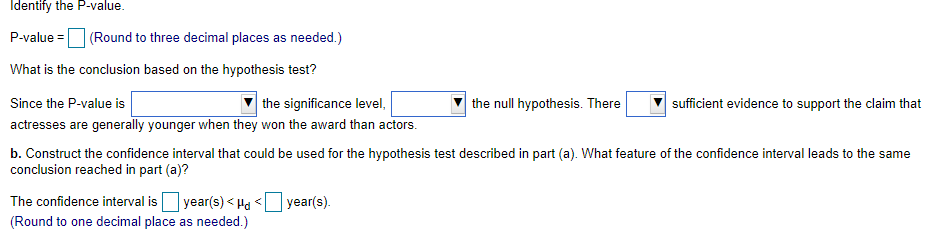
The following data lists the ages of a random selection of actresses when they won an award in the category of Best Actress, along with the ages of actors when they won in the category of Best Actor. The ages are matched according to the year that the awards were presented. Complete parts (a) and (b) below. Actress (years) 25 Actor (years) 29 27 37 29 23 45 33 40 36 31 37 50 43 41 30 32 32 D 60 40 a. Use the sample data with a 0.01 significance level to test the claim that for the population of ages of Best Actresses and Best Actors, the differences have a mean less than 0 (indicating that the Best Actresses are generally younger than Best Actors). In this example, Ha is the mean value of the differences d for the population of all pairs of data, where each individual difference d is defined as the actress's age minus the actor's age. What are the null and alternative hypotheses for the hypothesis test? Ho: Ha year(s) year(s) H1: H (Type integers or decimals. Do not round.) Identify the test statistic. t= (Round to two decimal places as needed.)


Correlation
Correlation defines a relationship between two independent variables. It tells the degree to which variables move in relation to each other. When two sets of data are related to each other, there is a correlation between them.
Linear Correlation
A correlation is used to determine the relationships between numerical and categorical variables. In other words, it is an indicator of how things are connected to one another. The correlation analysis is the study of how variables are related.
Regression Analysis
Regression analysis is a statistical method in which it estimates the relationship between a dependent variable and one or more independent variable. In simple terms dependent variable is called as outcome variable and independent variable is called as predictors. Regression analysis is one of the methods to find the trends in data. The independent variable used in Regression analysis is named Predictor variable. It offers data of an associated dependent variable regarding a particular outcome.
Need help finding these values


Trending now
This is a popular solution!

Step by step
Solved in 2 steps


