The following table gives the number of family members of a sample of employees in a company: Number of family No. of employees members 4 10 8 12 7 30 8 17 16 The mean number of family members is: Select one: 6.8 families O 8 families
The following table gives the number of family members of a sample of employees in a company: Number of family No. of employees members 4 10 8 12 7 30 8 17 16 The mean number of family members is: Select one: 6.8 families O 8 families

Glencoe Algebra 1, Student Edition, 9780079039897, 0079039898, 2018
18th Edition
ISBN:9780079039897
Author:Carter
Publisher:Carter
Chapter10: Statistics
Section10.5: Comparing Sets Of Data
Problem 1GP

Related questions
Question
12
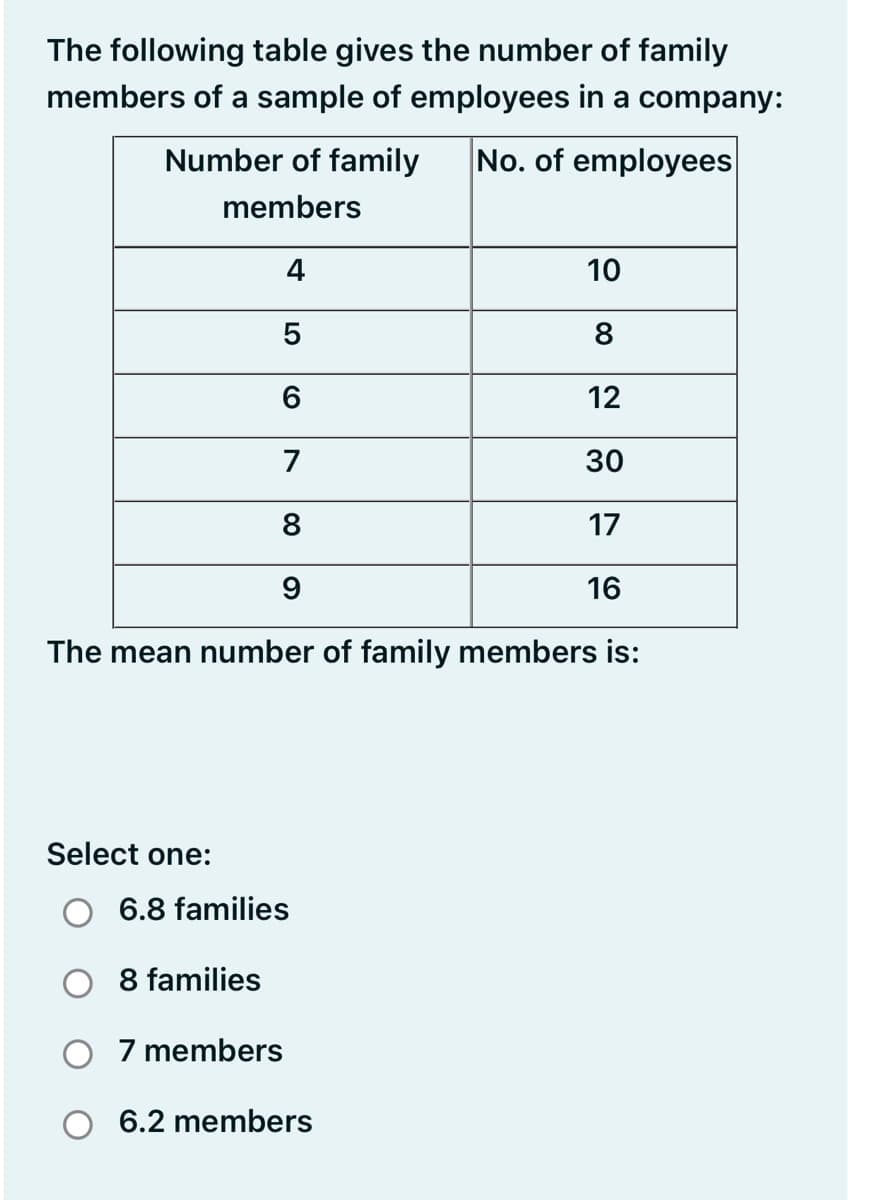
Transcribed Image Text:The following table gives the number of family
members of a sample of employees in a company:
Number of family
No. of employees
members
4
10
8
6.
12
7
30
8
17
16
The mean number of family members is:
Select one:
6.8 families
8 families
O 7 members
6.2 members
Expert Solution
This question has been solved!
Explore an expertly crafted, step-by-step solution for a thorough understanding of key concepts.

Step by step
Solved in 2 steps with 1 images

Recommended textbooks for you
Glencoe Algebra 1, Student Edition, 9780079039897…
Algebra
ISBN:
9780079039897
Author:
Carter
Publisher:
McGraw Hill
Glencoe Algebra 1, Student Edition, 9780079039897…
Algebra
ISBN:
9780079039897
Author:
Carter
Publisher:
McGraw Hill