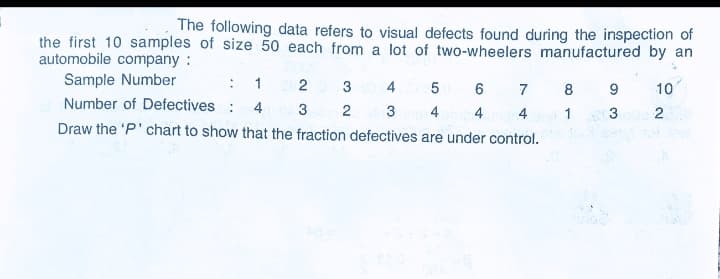
The following data refers to visual defects found during the inspection of the first 10 samples of size 50 each from a lot of two-wheelers manufactured by an automobile company : Sample Number : 1 Number of Defectives : 2 3 4 6 7 10 4 3 4 4 4 2 Draw the 'P'chart to show that the fraction defectives are under control.
The following data refers to visual defects found during the inspection of the first 10 samples of size 50 each from a lot of two-wheelers manufactured by an automobile company : Sample Number : 1 Number of Defectives : 2 3 4 6 7 10 4 3 4 4 4 2 Draw the 'P'chart to show that the fraction defectives are under control.

Glencoe Algebra 1, Student Edition, 9780079039897, 0079039898, 2018
18th Edition
ISBN:9780079039897
Author:Carter
Publisher:Carter
Chapter10: Statistics
Section10.5: Comparing Sets Of Data
Problem 14PPS

Related questions
Question
Transcribed Image Text:The following data refers to visual defects found during the inspection of
the first 10 samples of size 50 each from a lot of two-wheelers manufactured by an
automobile company :
Sample Number
:
2
3
4
7
8
10
Number of Defectives :
4
3
4
4
3
2
4
1
Draw the 'P' chart to show that the fraction defectives are under control.
Expert Solution
This question has been solved!
Explore an expertly crafted, step-by-step solution for a thorough understanding of key concepts.

Step by step
Solved in 3 steps with 3 images

Recommended textbooks for you
Glencoe Algebra 1, Student Edition, 9780079039897…
Algebra
ISBN:
9780079039897
Author:
Carter
Publisher:
McGraw Hill
Glencoe Algebra 1, Student Edition, 9780079039897…
Algebra
ISBN:
9780079039897
Author:
Carter
Publisher:
McGraw Hill