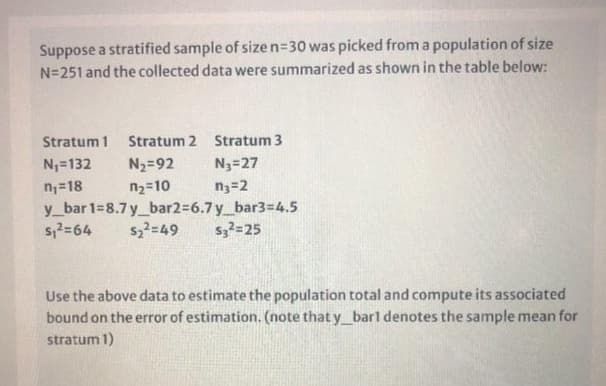
Suppose a stratified sample of sizen=30 was picked from a population of size N=251 and the collected data were summarized as shown in the table below: Stratum 1 Stratum 2 Stratum 3 N,=132 N2=92 N3=27 10


Q: from the given parameters of the population and sample size. and o Determine H-31, a =14, n-26…
A: We have to find out given data of parameter of the population and sample size..
Q: Suppose I want to sample the household incomes for EBR parish. Het's say I start with a simple…
A: Central limit theorem: If the population follows normal distribution or the sample size is large…
Q: A local brewery wishes to ensure that an average of 12 ounces of beer is used to fill each bottle.…
A:
Q: Determine μx and σx from the given parameters of the population and sample size. μ=82, σ=18,…
A: The mean of the sampling distribution of the sample mean is represented as and is given by:
Q: A random sample of 27 maple trees in Vermont were chosen and treated with one of three levels of…
A:
Q: An insurance company selected samples of clients under 18 years of age and over 18 and recorded the…
A: Two sample proportion test: Two sample proportion test is used to test the significance difference…
Q: Number of drivers involved with accidents during night time. Number of drivers involved with…
A:
Q: Consider the population consisting of the values (1, 3, 8) i. List all the possible samples of size…
A: Given : Population size (N) = 3 (1,3,8)
Q: Suppose that three drugs used to reduce cholesterol are compared in a randomized experiment in which…
A: Excel Procedure: Enter the data for 1, 2, 3 in Excel sheet>Go to Data Menu>Click on Data…
Q: How many different samples of size n can be obtained from the following population N sizes? NCn 1. 4…
A: we know that NCn=N!N-n!×n!
Q: The following table is based on a random sample of people age 18 and older who said they were…
A: b) Given information: Male Female Total Bringing a laptop 354 307 661 Not Bringing a laptop…
Q: The following data refers to visual defects found during the inspection of the first 10 samples of…
A:
Q: A study is run to compare participants assigned to different diet programs and the data are analyzed…
A:
Q: Table 1 gives flight arrival numbers from a random sample of flights for two airlines.…
A: Given data
Q: Is there reason to believe that a relationship exists between heights of fathers and the heights of…
A:
Q: The purpose of this study was to demonstrate that soy beans inoculated with nitrogen-fixing bacteria…
A: Let X denotes the inoculated plant yield & Y denotes the un-inoculated plant yield To test…
Q: A university dean is interested in determining the proportion of students who receive some sort of…
A: Solution: The proportion of students who are receiving financial aid is calculated as: The dean…
Q: In the study described in the paper, "Exposure to Diesel Exhaust Induces Changes in EEG in Human…
A: Confidence Interval: It is a range of values in which the required population parameter can be in…
Q: a) A tube of toothpaste is set to be automatically filled to 6.35 ounces. Every four hours 4 tubes…
A: Since you have posted a question with multiple sub-parts, we will solve the first three sub-parts…
Q: The sample data are summarized as follows: Muscat Dhofar n,=260 n=150 Mean cost =170 RO Mean cost Y:…
A: Since you have posted a question with multiple sub-parts, we will solve first three subparts for…
Q: (i) In a survey, consider two large samples of size 1550 and 1750 (in numbers), which have mean 64.5…
A: Please note that both the questions provided are two completely different questions. As per our…
Q: Determine μx and σx from the given parameters of the population and sample size. μ=80, σ=24, n=…
A:
Q: How many possible samples of size 5 are possible from a population of size 70?
A: Combination Rule: The arrangement of r objects from n different objects is given by:
Q: Of the electric bills for a samle of 40 families Electric bill Number of families 2 12-16 14 4-8…
A:
Q: Consider the patient data in the table below. Suppose that patients are randomly selected with…
A: Let X be the number of LWBS patients in this sample of size n. X ~ Binomial distribution with…
Q: 1. How many possible samples of size 2 can be formed? 2. List all these possible samples and…
A: here given box contains 4 balls numbered 1,3,5,7 two balls are chosen from this box with…
Q: Find the variance for the population consisting of the measurements ½, ¼, 1/3, ½, and 1/8 by using…
A: The population mean is, μ=∑XN=12+6+8+12+35=415=8.2 The population mean is 8.2.
Q: Suppose that a random sample of size 1 is to be taken from a finite population of size N. a. How…
A: (a)Justification:When the sample size is 1 then the samples that are possible to drawn without…
Q: Determine and o; from the given parameters of the population and sample size. µ= 48, o = 25, n = 39…
A:
Q: Suppose a hospital is concerned about the delay in transferring older patients to long-term…
A: Let x be the length of the delay in McAllen Hospital and y be the length of the delay in Mission…
Q: How many different samples of size n can be obtained from the following population N sizes? NCn 1. 4…
A:
Q: Determine the number of different samples of the given size n that can be drawn from the given…
A: Given N n 7 3 15 5 50 4 10 3 25 4 No. of possible samples= CnN
Q: The formula for total variance (SST) is
A: Solution:-
Q: Determine and from the given parameters of the population and sample size. H=73, o = 7, n= 49 -ロ
A: Using the sampling distribution, the mean of sample isμx=μ=73
Q: The symbol μx¯ represents the population mean of all possible sample means from samples of size n.…
A: Given that, The symbol µx̄ represents the population mean of all possible sample means from samples…
Q: If a t-test dependent samples produced t(18) - 3.32, p < .01, 2-tails test, how many participants…
A: The type of test is two tailed test The value of t-test statistic for depend samples is, t = 3.32…
Q: is computed from a sample and is used to estimate a population parameter.
A: 2. Parameter: The population parameter is the number that describes the population. Also, the…
Q: Table 7 lists the numbers of violent crimes reported to police on randomly selected days for this…
A:
Q: In order to estimate the difference between the average Miles per Gallon of two different models of…
A: Independent samples t-test is done to test the significance difference between population means.
Q: Determine and o, from the given parameters of the population and sample size. µ = 75, o = 24, n = 64…
A: The normal distribution is a continuous distribution that has many real-life applications. A normal…
Q: The table below shows the lists of weights (in pounds) of paper discarded by a sample of.…
A: It is given that the list of weights of paper along with the sizes of the households.
Q: Determine ; and o; from the given parameters of the population and sample size. u= 38, o = 19, n= 23…
A: Mean = 38 Standard deviation = 19 Sample size , n = 23
Q: A sample of 30 plants heights in a nursery is given in below table: 3.65 3.78 3.60 3.70 3.85…
A: Given:
Q: Es was selected from a process s), along with the sample rang Process Data
A: From the given information,
Q: For each scenario listed below, determine whether the scenario represents an Independent Samples or…
A: Independent samples: This generally deals with unrelated samples. They are selected at random such…
Q: Determine and o; from the given parameters of the population and sample size. H= 55, o = 6, n= 40
A: Solution-: Given: We find, and
Q: For a normal population, if a sample of size 25, sample mean= 2.3 and SD= 9.8. Then The 95% one-…
A: Obtain the 95% two-sided CI lower bound for the population mean. The 95% two-sided CI lower bound…
Q: The human resource department at a certain company wants to conduct a survey regarding worker…
A: According to the provided data, the population size is 2434 and the sample size is 30. The human…
Q: Determine and o from the given parameters of the population and sample size. H= 50, o = 20, n= 40
A: From the provided information, Sample size (n) = 40 Mean (µ) = 50 Population standard deviation (σ)…

Step by step
Solved in 2 steps

- In this study, the protection of aquatic ecosystems is an important goal of Ville de Montréal. In particular, Thomas wants to see whether the contamination of creeks (ruisseaux in French) by Escherichia coli differs among the months of May, June, July, and August. Therefore, he randomly samples six creeks in different areas. For each creek, he collects water samples from May to August, and measures the amount of E. coli, expressed in colony forming units (CFU) per 100 mL of water. For each combination of a month and a creek, he thus obtains an E. coli contamination value, i.e., 24 observations in total. A preliminary statistical analysis produces the following results. 13-a) Does the mean E. coli contamination differ significantly among the four months? Justify your answer to this question with the result of a statistical test. Use α = 0.05. 13-b) Which pairs of months show significant differences in mean E. coli contamination? Explain your reasoning and justify your answer…The 5-year incidence of cardiovascular disease (CVD) in relation to smoking status was determined in a population sample of 1000 men, 18 years and older. At baseline, 30% of the men were classified as being current smokers and 70% as being non-smokers. At the end of the follow-up, 60 CVD events had occurred among the smokers and 70 events among the non-smokers. Construct a 2 x 2 table based on the data providedAn analysis was conducted by the Statistics Consulting Center atVirginia Polytechnic Institute and State University in which acertain treatment was applied to a set of tree stumps. The chemicalGarlon was used the with the purpose of regenerating the roots ofthe stumps. A spray was used with four levels of GarlonPage 23 of 23concentration. After a period of time the height of the shoots wasobserved. Does the concentration of Garlon has a significantimpact on the height of the shoots? Use α = 0.05.
- Tardigrades, or water bears, are a type of micro-animal famous for their resilience. In examining the effects of radiation on organisms, an expert claimed that the amount of gamma radiation needed to sterilize a colony of tardigrades no longer has a mean of 1350 Gy (grays). (For comparison, humans cannot withstand more than 10 Gy .) A study was conducted on a sample of 18 randomly selected tardigrade colonies, finding that the amount of gamma radiation needed to sterilize a colony had a sample mean of 1375 Gy , with a sample standard deviation of 75 Gy . Assume that the population of amounts of gamma radiation needed to sterilize a colony of tardigrades is approximately normally distributed. Complete the parts below to perform a hypothesis test to see if there is enough evidence, at the 0.05 level of significance, to support the claim that μ , the mean amount of gamma radiation needed to sterilize a colony of tardigrades, is not equal to 1350 Gy .Tardigrades, or water bears, are a type of micro-animal famous for their resilience. In examining the effects of radiation on organisms, an expert claimed that the amount of gamma radiation needed to sterilize a colony of tardigrades no longer has a mean of 900 Gy (grays). (For comparison, humans cannot withstand more than 10 Gy .) A study was conducted on a sample of 27 randomly selected tardigrade colonies, finding that the amount of gamma radiation needed to sterilize a colony had a sample mean of 907 Gy , with a sample standard deviation of 17 Gy . Assume that the population of amounts of gamma radiation needed to sterilize a colony of tardigrades is approximately normally distributed. Complete the parts below to perform a hypothesis test to see if there is enough evidence, at the 0.05 level of significance, to support the claim that μ , the mean amount of gamma radiation needed to sterilize a colony of tardigrades, is not equal to 900…Tardigrades, or water bears, are a type of micro-animal famous for their resilience. In examining the effects of radiation on organisms, an expert claimed that the amount of gamma radiation needed to sterilize a colony of tardigrades no longer has a mean of 900 Gy (grays). (For comparison, humans cannot withstand more than 10 Gy .) A study was conducted on a sample of 27 randomly selected tardigrade colonies, finding that the amount of gamma radiation needed to sterilize a colony had a sample mean of 907 Gy , with a sample standard deviation of 17 Gy . Assume that the population of amounts of gamma radiation needed to sterilize a colony of tardigrades is approximately normally distributed. Complete the parts below to perform a hypothesis test to see if there is enough evidence, at the 0.05 level of significance, to support the claim that μ , the mean amount of gamma radiation needed to sterilize a colony of tardigrades, is not equal to 900…
- A manufacturer is developing a nickel-metal hydride battery to be used in cellular telephones instead of a nickel-cadmium battery. The director of quality control decides to evaluate the newly developed battery by picking a random sample of employees with cellular phones and asking them to use both phones until the batteries run down. The results are given in the excel data file. At the 5% level of significance is there evidence that the new battery provides more minutes of talk time per battery charge? Show your work and give your answer in complete sentences in context of the problem. Data Table: Person Old Battery Type New Battery Type 1 72.39 89.95 2 75.25 64.60 3 82.10 71.25 4 58.98 87.07 5 67.07 103.11 6 35.98 76.46 7 75.37 83.92 8 66.00 83.42 9 73.14 84.30 10 67.14 92.48 11 83.06 93.48 12 57.00 59.11 13 65.92 92.27 14 76.12 61.81 15 85.21 72.83 16 80.73 42.17 17 60.65 83.89 18 36.63 94.41 19 77.98 70.30 20 75.40 77.72 21 84.70 84.35…In clinical trails of Nasonex, 3774 adult and adolenscent allergy patients 12 years and older were randomly divided into two groups. The patient in group1 (experimental group) received 200 microgram of Nasonex, while the patient in group 2( control group) receiced a placebo. Of the 2103 patients in the experimental group 547 reported headaches as a side effect. Of the 1671 patients in the control group, 368 reported headaches as a side effect. Determine if the proportion of those taking Nasonex who experienced headaches as a side effect differs from that of those taking the placebo who experienced headaches as a side effect. A) state the null and alternative hypothese: B) construct a 95% confidence interval for the difference between these groups round to 4 places. Intervals: C)using intervals, state conclusion in the language of the problem.In three randomly selected groups of patients (a,b,C) and normal healthy individuals (control group), Serum total Protein (STP) values were measured and their differences, if any, were investigated compared to the control group. The following table shows the STP values measured in 5 randomly selected individuals for each group for this purpose. Accordingly, do the STP values of these individuals differ significantly according to the groups? If there are differences between the groups, find out which groups are different compared to the normal healthy group (control group). A B C NORMAL GROUP 1 8.5 11.7 14.8 6.4 2 9.7 12.8 17.9 6.5 3 12.1 14.9 21.6 6.7 4 9.6 16.3 15 5.9 5 9.4 15.4 12 6
- what is the meaning of weighted unifrac beta diversity and unweighted unifrac diversity? How to interpretate the data value?People often wait till middle age to worry about having a healthy heart. However, recent studies have shown that earlier monitoring of risk factors such as blood pressure can be very beneficial (The Wall Street Journal, January 10, 2012). Having higher than normal blood pressure, a condition known as hypertension, is a major risk factor for heart disease. Suppose a large sample of individuals of various ages and gender was selected and that each individual’s blood pressure was measured to determine if they have hypertension. For the sample data, the following table shows the percentage of individuals with hypertension. Develop a side-by-side bar chart with age on the horizontal axis, the percentage of individuals with hypertension on the vertical axis, and side-by-side bars based on gender. What does the display you developed in part (a), indicate about hypertension and age? Comment on differences in gender. Age Male Female 20 - 34 11.0% 9.0% 35 – 44…A geneticist conducted a hybridization experiment with peas, which resulted in offspring consisting of 410 peas with green pods and 150 peas with yellow pods. According to Mendel’s theory, 1/4 of the offspring peas should have yellow pods. Use a 0.05 significance level to test the claim that the proportion of peas with yellow pods is equal to 0.25. Provide answers below.


