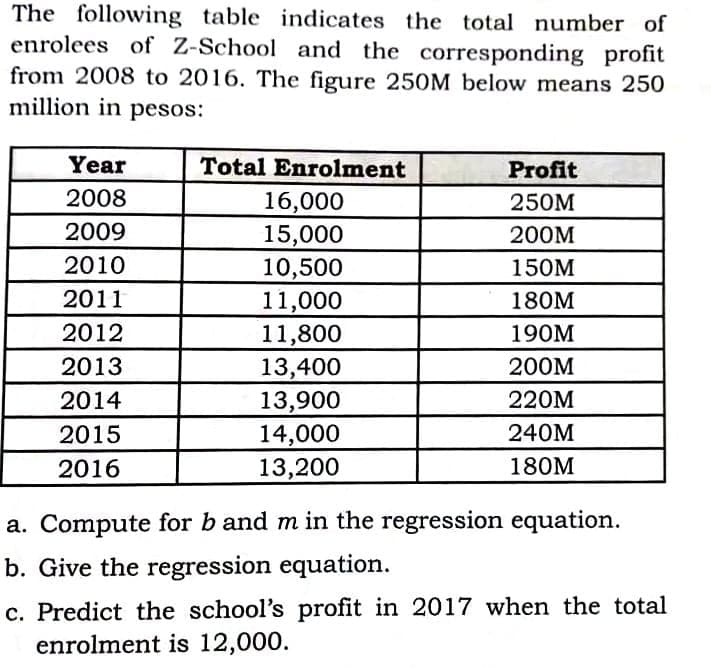
The following table indicates the total number of enrolees of Z-School and the corresponding profit from 2008 to 2016. The figure 250M below means 250 million in pesos: Year Total Enrolment Profit 2008 16,000 15,000 10,500 11,000 11,800 250M 2009 200M 2010 150M 2011 180M 2012 190M 2013 13,400 200M 13,900 14,000 2014 220M 2015 240M 2016 13,200 180M a. Compute for b and m in the regression equation. p. Give the regression equation. c. Predict the school's profit in 2017 when the total enrolment is 12,000.
The following table indicates the total number of enrolees of Z-School and the corresponding profit from 2008 to 2016. The figure 250M below means 250 million in pesos: Year Total Enrolment Profit 2008 16,000 15,000 10,500 11,000 11,800 250M 2009 200M 2010 150M 2011 180M 2012 190M 2013 13,400 200M 13,900 14,000 2014 220M 2015 240M 2016 13,200 180M a. Compute for b and m in the regression equation. p. Give the regression equation. c. Predict the school's profit in 2017 when the total enrolment is 12,000.

Chapter9: Sequences, Probability And Counting Theory
Section: Chapter Questions
Problem 18PT: To allocate annual bonuses, a manager must choose his top four employees and rank them first to...

Related questions
Question
Transcribed Image Text:The following table indicates the total number of
enrolees of Z-School and the corresponding profit
from 2008 to 2016. The figure 250M below means 250
million in pesos:
Year
Total Enrolment
Profit
2008
16,000
15,000
10,500
250M
2009
200M
2010
150M
2011
11,000
180M
2012
11,800
13,400
13,900
190M
2013
200M
2014
220M
14,000
13,200
2015
240M
2016
180M
a. Compute for b and m in the regression equation.
b. Give the regression equation.
c. Predict the school's profit in 2017 when the total
enrolment is 12,000.
Expert Solution
This question has been solved!
Explore an expertly crafted, step-by-step solution for a thorough understanding of key concepts.

This is a popular solution!

Trending now
This is a popular solution!

Step by step
Solved in 3 steps with 3 images

Recommended textbooks for you
