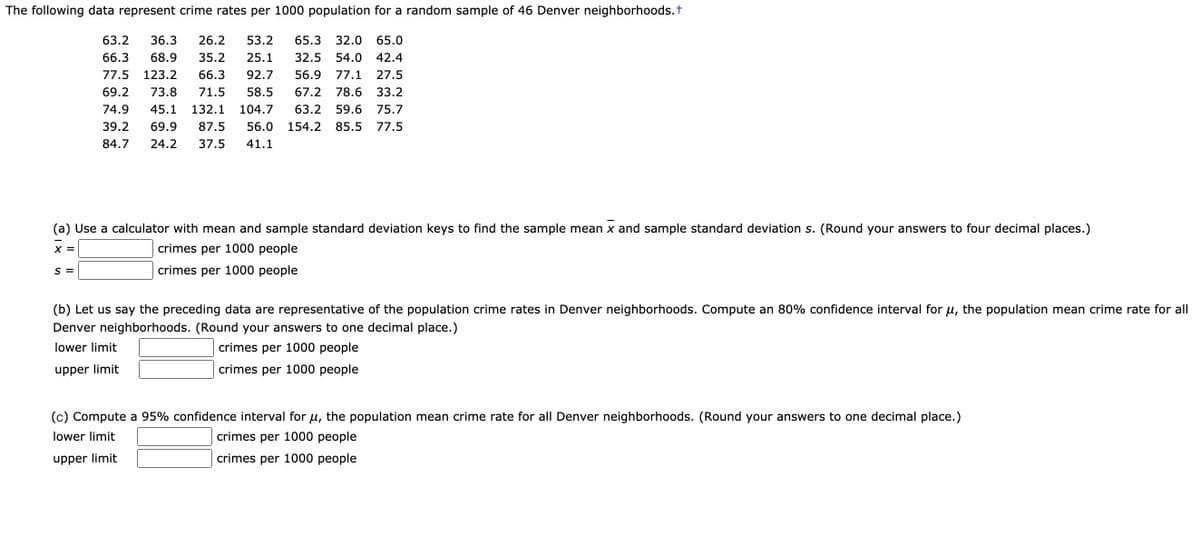
The following data represent crime rates per 1000 population for a random sample of 46 Denver neighborhoods.t 63.2 36.3 26.2 53.2 65.3 32.0 65.0 66.3 68.9 35.2 25.1 32.5 54.0 42.4 77.5 123.2 66.3 92.7 56.9 77.1 27.5 69.2 73.8 71.5 58.5 67.2 78.6 33.2 74.9 45.1 132.1 104.7 63.2 59.6 75.7 39.2 69.9 87.5 56.0 154.2 85.5 77.5 84.7 24.2 37.5 41.1 (a) Use a calculator with mean and sample standard deviation keys to find the sample mean x and sample standard deviation s. (Round your answers to four decimal places.) X = crimes per 1000 people crimes per 1000 people (b) Let us say the preceding data are representative of the population crime rates in Denver neighborhoods. Compute an 80% confidence interval for u, the population mean crime rate for all Denver neighborhoods. (Round your answers to one decimal place.) lower limit crimes per 1000 people upper limit crimes per 1000 people (c) Compute a 95% confidence interval for u, the population mean crime rate for all Denver neighborhoods. (Round your answers to one decimal place.) lower limit crimes per 1000 people upper limit crimes per 1000 people
The following data represent crime rates per 1000 population for a random sample of 46 Denver neighborhoods.t 63.2 36.3 26.2 53.2 65.3 32.0 65.0 66.3 68.9 35.2 25.1 32.5 54.0 42.4 77.5 123.2 66.3 92.7 56.9 77.1 27.5 69.2 73.8 71.5 58.5 67.2 78.6 33.2 74.9 45.1 132.1 104.7 63.2 59.6 75.7 39.2 69.9 87.5 56.0 154.2 85.5 77.5 84.7 24.2 37.5 41.1 (a) Use a calculator with mean and sample standard deviation keys to find the sample mean x and sample standard deviation s. (Round your answers to four decimal places.) X = crimes per 1000 people crimes per 1000 people (b) Let us say the preceding data are representative of the population crime rates in Denver neighborhoods. Compute an 80% confidence interval for u, the population mean crime rate for all Denver neighborhoods. (Round your answers to one decimal place.) lower limit crimes per 1000 people upper limit crimes per 1000 people (c) Compute a 95% confidence interval for u, the population mean crime rate for all Denver neighborhoods. (Round your answers to one decimal place.) lower limit crimes per 1000 people upper limit crimes per 1000 people

Glencoe Algebra 1, Student Edition, 9780079039897, 0079039898, 2018
18th Edition
ISBN:9780079039897
Author:Carter
Publisher:Carter
Chapter10: Statistics
Section10.4: Distributions Of Data
Problem 19PFA

Related questions
Topic Video
Question
Transcribed Image Text:The following data represent crime rates per 1000 population for a random sample of 46 Denver neighborhoods.t
63.2
36.3
26.2
53.2
65.3
32.0
65.0
66.3
68.9
35.2
25.1
32.5
54.0
42.4
77.5
123.2
66.3
92.7
56.9
77.1
27.5
69.2
73.8
71.5
58.5
67.2
78.6
33.2
74.9
45.1
132.1
104.7
63.2
59.6
75.7
39.2
69.9
87.5
56.0
154.2
85.5
77.5
84.7
24.2
37.5
41.1
(a) Use a calculator with mean and sample standard deviation keys to find the sample mean x and sample standard deviation s. (Round your answers to four decimal places.)
X =
crimes per 1000 people
S =
crimes per 1000 people
(b) Let us say the preceding data are representative of the population crime rates in Denver neighborhoods. Compute an 80% confidence interval for u, the population mean crime rate for all
Denver neighborhoods. (Round your answers to one decimal place.)
lower limit
crimes per 1000 people
upper limit
crimes per 1000 people
(c) Compute a 95% confidence interval for u, the population mean crime rate for all Denver neighborhoods. (Round your answers to one decimal place.)
lower limit
crimes per 1000 people
upper limit
crimes per 1000 people
Expert Solution
This question has been solved!
Explore an expertly crafted, step-by-step solution for a thorough understanding of key concepts.

This is a popular solution!

Trending now
This is a popular solution!

Step by step
Solved in 2 steps with 5 images

Knowledge Booster


Learn more about
Need a deep-dive on the concept behind this application? Look no further. Learn more about this topic, statistics and related others by exploring similar questions and additional content below.Recommended textbooks for you
Glencoe Algebra 1, Student Edition, 9780079039897…
Algebra
ISBN:
9780079039897
Author:
Carter
Publisher:
McGraw Hill
Glencoe Algebra 1, Student Edition, 9780079039897…
Algebra
ISBN:
9780079039897
Author:
Carter
Publisher:
McGraw Hill