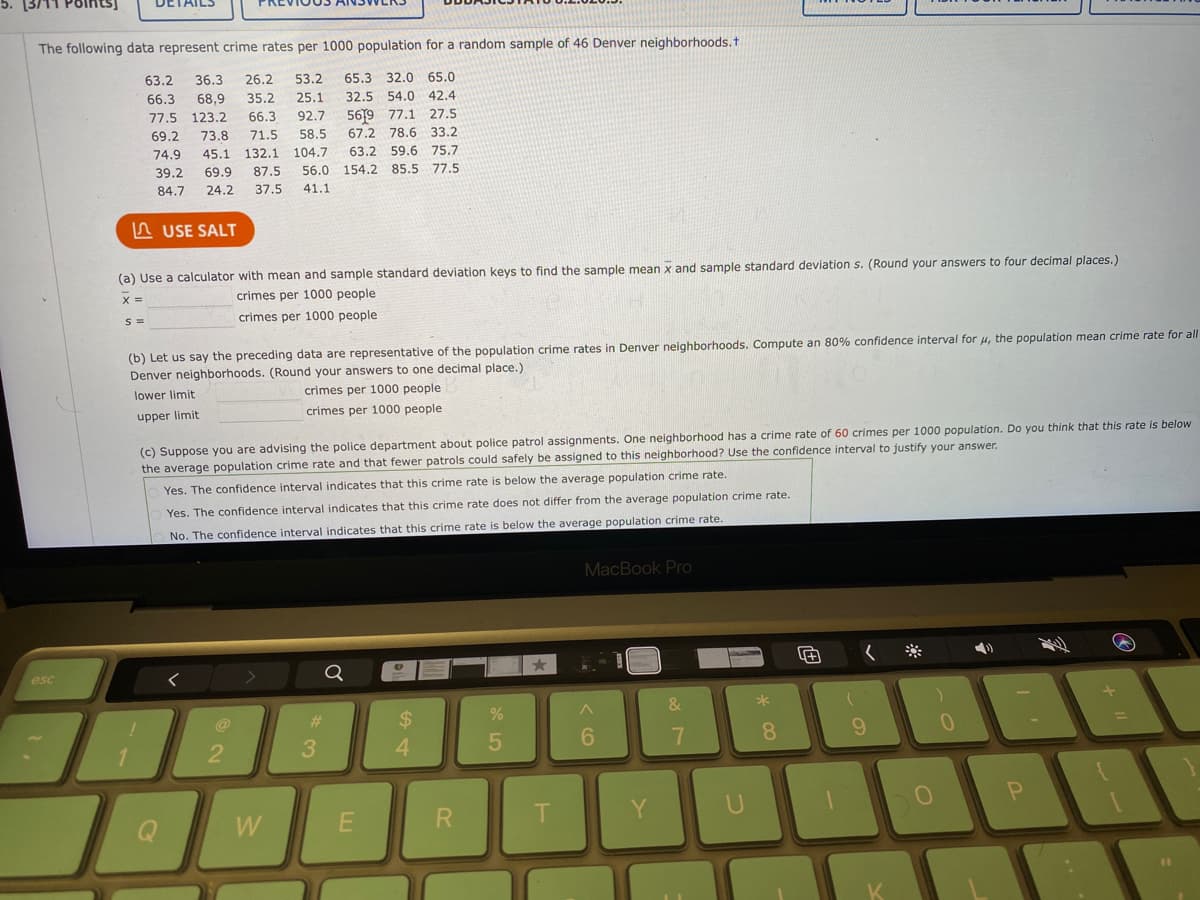
The following data represent crime rates per 1000 population for a random sample of 46 Denver neighborhoods.t 63.2 36.3 26.2 53.2 65.3 32.0 65.0 66.3 68,9 35.2 25.1 32.5 54.0 42.4 77.5 123.2 66.3 92.7 5619 77.1 27.5 69.2 73.8 71.5 58.5 67.2 78.6 33.2 74.9 45.1 132.1 104.7 63.2 59.6 75.7 39.2 69.9 87.5 56.0 154.2 85.5 77.5 84.7 24.2 37.5 41.1 A USE SALT (a) Use a calculator with mean and sample standard deviation keys to find the sample mean x and sample standard deviation s. (Round your answers to four decimal places.) crimes per 1000 people S = crimes per 1000 people (b) Let us say the preceding data are representative of the population crime rates in Denver neighborhoods. Compute an 80% confidence interval for u, the population mean crime rate for all Denver neighborhoods. (Round your answers to one decimal place.) lower limit crimes per 1000 people upper limit crimes per 1000 people (c) Suppose you are advising the police department about police patrol assignments. One neighborhood has a crime rate of 60 crimes per 1000 population. Do you think that this rate is below the average population crime rate and that fewer patrols could safely be assigned to this neighborhood? Use the confidence interval to justify your answer. Yes. The confidence interval indicates that this crime rate is below the average population crime rate. Yes. The confidence interval indicates that this crime rate does not differ from the average population crime rate. No. The confidence interval indicates that this crime rate is below the average population crime rate.
The following data represent crime rates per 1000 population for a random sample of 46 Denver neighborhoods.t 63.2 36.3 26.2 53.2 65.3 32.0 65.0 66.3 68,9 35.2 25.1 32.5 54.0 42.4 77.5 123.2 66.3 92.7 5619 77.1 27.5 69.2 73.8 71.5 58.5 67.2 78.6 33.2 74.9 45.1 132.1 104.7 63.2 59.6 75.7 39.2 69.9 87.5 56.0 154.2 85.5 77.5 84.7 24.2 37.5 41.1 A USE SALT (a) Use a calculator with mean and sample standard deviation keys to find the sample mean x and sample standard deviation s. (Round your answers to four decimal places.) crimes per 1000 people S = crimes per 1000 people (b) Let us say the preceding data are representative of the population crime rates in Denver neighborhoods. Compute an 80% confidence interval for u, the population mean crime rate for all Denver neighborhoods. (Round your answers to one decimal place.) lower limit crimes per 1000 people upper limit crimes per 1000 people (c) Suppose you are advising the police department about police patrol assignments. One neighborhood has a crime rate of 60 crimes per 1000 population. Do you think that this rate is below the average population crime rate and that fewer patrols could safely be assigned to this neighborhood? Use the confidence interval to justify your answer. Yes. The confidence interval indicates that this crime rate is below the average population crime rate. Yes. The confidence interval indicates that this crime rate does not differ from the average population crime rate. No. The confidence interval indicates that this crime rate is below the average population crime rate.

Glencoe Algebra 1, Student Edition, 9780079039897, 0079039898, 2018
18th Edition
ISBN:9780079039897
Author:Carter
Publisher:Carter
Chapter10: Statistics
Section10.4: Distributions Of Data
Problem 19PFA

Related questions
Question
Transcribed Image Text:The following data represent crime rates per 1000 population for a random sample of 46 Denver neighborhoods.t
63.2
36.3
26.2
53.2
65.3 32.0 65.0
66.3
68,9
35.2
25.1
32.5 54.0
42.4
77.5 123.2
66.3
92.7
569 77.1
67.2 78.6 33.2
27.5
69.2
73.8
71.5
58.5
74.9
45.1
132.1 104.7
63.2 59.6 75.7
39.2
69.9
87.5
56.0 154.2 85.5 77.5
84.7
24.2
37.5
41.1
n USE SALT
(a) Use a calculator with mean and sample standard deviation keys to find the sample mean x and sample standard deviation s. (Round your answers to four decimal places.)
crimes per 1000 people
S =
crimes per 1000 people
(b) Let us say the preceding data are representative of the population crime rates in Denver neighborhoods. Compute an 80% confidence interval for u, the population mean crime rate for all
Denver neighborhoods. (Round your answers to one decimal place.)
lower limit
crimes per 1000 people
upper limit
crimes per 1000 people
(c) Suppose you are advising the police department about police patrol assignments. One neighborhood has a crime rate of 60 crimes per 1000 population. Do you think that this rate is below
the average population crime rate and
fewer patrols could safely be assigned to this neighborhood? Use the confidence interval to justify your answer.
Yes. The confidence interval indicates that this crime rate is below the average population crime rate.
Yes. The confidence interval indicates that this crime rate does not differ from the average population crime rate.
No. The confidence interval indicates that this crime rate is below the average population crime rate.
MacBook Pro
Q
esc
$
4.
6.
8.
9.
W
R
Y
* 3
Expert Solution
This question has been solved!
Explore an expertly crafted, step-by-step solution for a thorough understanding of key concepts.

Step by step
Solved in 2 steps with 1 images

Recommended textbooks for you
Glencoe Algebra 1, Student Edition, 9780079039897…
Algebra
ISBN:
9780079039897
Author:
Carter
Publisher:
McGraw Hill
Glencoe Algebra 1, Student Edition, 9780079039897…
Algebra
ISBN:
9780079039897
Author:
Carter
Publisher:
McGraw Hill