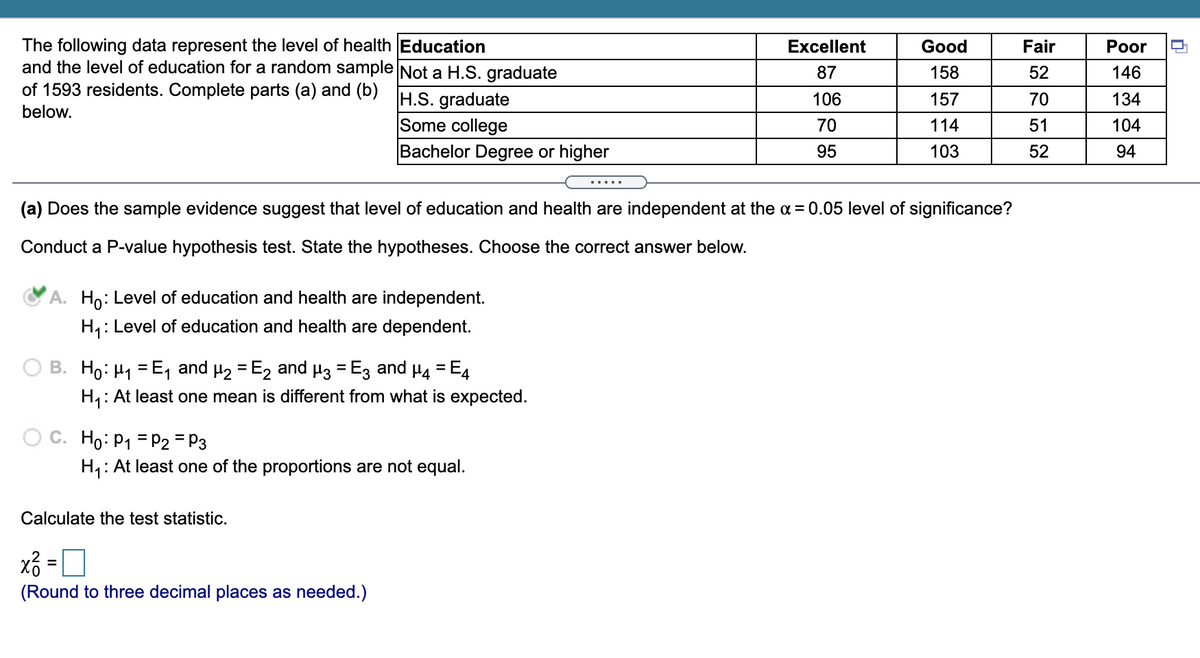
The following data represent the level of health Education and the level of education for a random sample Not a H.S. graduate of 1593 residents. Complete parts (a) and (b) H.S. graduate Excellent Good Fair Poor 87 158 52 146 106 157 70 134 below. Some college Bachelor Degree or higher 70 114 51 104 95 103 52 94 ..... (a) Does the sample evidence suggest that level of education and health are independent at the a = 0.05 level of significance? Conduct a P-value hypothesis test. State the hypotheses. Choose the correct answer below. A. Ho: Level of education and health are independent. H4: Level of education and health are dependent. O B. Ho: H1 =E, and µ2 = E2 and µ3 = Ez and H4 = E4 H4: At least one mean is different from what is expected. O C. Ho: P1 = P2 = P3 H,: At least one of the proportions are not equal. Calculate the test statistic. xổ = D %3D (Round to three decimal places as needed.)
The following data represent the level of health Education and the level of education for a random sample Not a H.S. graduate of 1593 residents. Complete parts (a) and (b) H.S. graduate Excellent Good Fair Poor 87 158 52 146 106 157 70 134 below. Some college Bachelor Degree or higher 70 114 51 104 95 103 52 94 ..... (a) Does the sample evidence suggest that level of education and health are independent at the a = 0.05 level of significance? Conduct a P-value hypothesis test. State the hypotheses. Choose the correct answer below. A. Ho: Level of education and health are independent. H4: Level of education and health are dependent. O B. Ho: H1 =E, and µ2 = E2 and µ3 = Ez and H4 = E4 H4: At least one mean is different from what is expected. O C. Ho: P1 = P2 = P3 H,: At least one of the proportions are not equal. Calculate the test statistic. xổ = D %3D (Round to three decimal places as needed.)

Glencoe Algebra 1, Student Edition, 9780079039897, 0079039898, 2018
18th Edition
ISBN:9780079039897
Author:Carter
Publisher:Carter
Chapter10: Statistics
Section10.4: Distributions Of Data
Problem 19PFA

Related questions
Question
Transcribed Image Text:The following data represent the level of health Education
and the level of education for a random sample Not a H.S. graduate
of 1593 residents. Complete parts (a) and (b)
Excellent
Good
Fair
Рor
87
158
52
146
H.S. graduate
Some college
Bachelor Degree or higher
106
157
70
134
below.
70
114
51
104
95
103
52
94
....
(a) Does the sample evidence suggest that level of education and health are independent at the a = 0.05 level of significance?
Conduct a P-value hypothesis test. State the hypotheses. Choose the correct answer below.
A. Ho: Level of education and health are independent.
H: Level of education and health are dependent.
B. Ho: H1 = E, and µ2 = E, and µz = Ez and
H4 = E4
%3D
%3D
H,: At least one mean is different from what is expected.
O C. Ho: P1 = P2 = P3
H,: At least one of the proportions are not equal.
Calculate the test statistic.
(Round to three decimal places as needed.)
Expert Solution
This question has been solved!
Explore an expertly crafted, step-by-step solution for a thorough understanding of key concepts.

This is a popular solution!

Trending now
This is a popular solution!

Step by step
Solved in 3 steps with 1 images

Recommended textbooks for you
Glencoe Algebra 1, Student Edition, 9780079039897…
Algebra
ISBN:
9780079039897
Author:
Carter
Publisher:
McGraw Hill

College Algebra (MindTap Course List)
Algebra
ISBN:
9781305652231
Author:
R. David Gustafson, Jeff Hughes
Publisher:
Cengage Learning
Glencoe Algebra 1, Student Edition, 9780079039897…
Algebra
ISBN:
9780079039897
Author:
Carter
Publisher:
McGraw Hill
College Algebra (MindTap Course List)
Algebra
ISBN:
9781305652231
Author:
R. David Gustafson, Jeff Hughes
Publisher:
Cengage Learning