The following data represent the pH of rain for a random sample of 12 rain dates. A normal probability plot suggests the data could come from a population that is normally distributed. A boxplot indicates there are no outliers. Complete parts (a) through (d) below. 5.30 5.72 5.24 4.74 4.80 5.19 ts 5.02 4.57 4.61 4.76 4.56 4.68 ts choice nts (Use ascending order. Round to two decimal places as needed.) me O A. If repeated samples are taken, 99% of them will have a sample pH of rain water between and O B. There is a 99% probability that the true mean pH of rain water is between and ents C. There is 99% confidence that the population mean pH of rain water is between 4.61 and 5.26. ents (d) What happens to the interval as the level of confidence is changed? Explain why this is a logical result. ents As the level of confidence increases, the width of the interval increases. This makes sense since including more numbers for consideration makes it more likely one of them is correct. ebook
The following data represent the pH of rain for a random sample of 12 rain dates. A normal probability plot suggests the data could come from a population that is normally distributed. A boxplot indicates there are no outliers. Complete parts (a) through (d) below. 5.30 5.72 5.24 4.74 4.80 5.19 ts 5.02 4.57 4.61 4.76 4.56 4.68 ts choice nts (Use ascending order. Round to two decimal places as needed.) me O A. If repeated samples are taken, 99% of them will have a sample pH of rain water between and O B. There is a 99% probability that the true mean pH of rain water is between and ents C. There is 99% confidence that the population mean pH of rain water is between 4.61 and 5.26. ents (d) What happens to the interval as the level of confidence is changed? Explain why this is a logical result. ents As the level of confidence increases, the width of the interval increases. This makes sense since including more numbers for consideration makes it more likely one of them is correct. ebook

Glencoe Algebra 1, Student Edition, 9780079039897, 0079039898, 2018
18th Edition
ISBN:9780079039897
Author:Carter
Publisher:Carter
Chapter10: Statistics
Section10.4: Distributions Of Data
Problem 19PFA

Related questions
Question
D
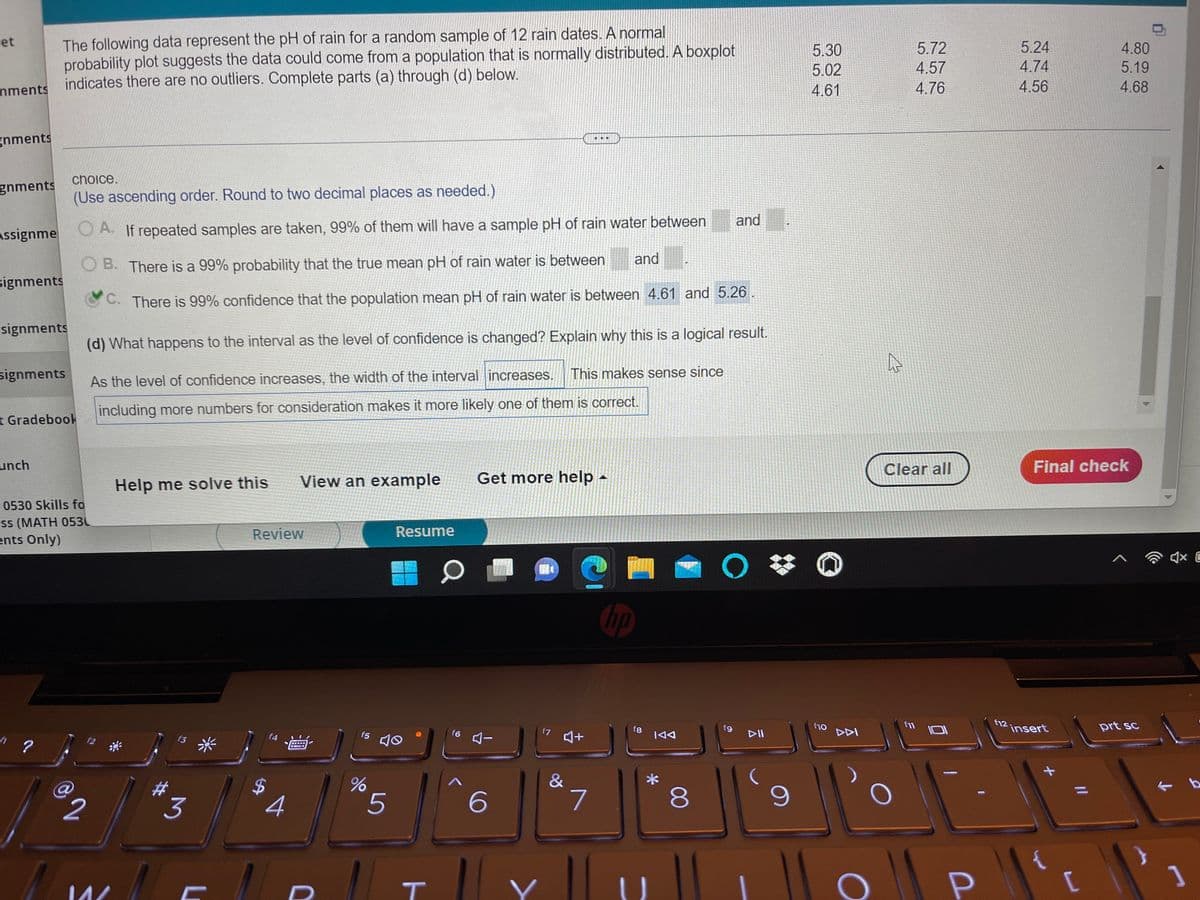
Transcribed Image Text:The following data represent the pH of rain for a random sample of 12 rain dates. A normal
probability plot suggests the data could come from a population that is normally distributed. A boxplot
indicates there are no outliers. Complete parts (a) through (d) below.
et
5.30
5.72
5.24
4.80
5.02
4.57
4.74
5.19
mments
4.61
4.76
4.56
4.68
gnments
choice.
gnments
(Use ascending order. Round to two decimal places as needed.)
and
Assignme
O A. If repeated samples are taken, 99% of them will have a sample pH of rain water between
and
O B. There is a 99% probability that the true mean pH of rain water is between
signments
C. There is 99% confidence that the population mean pH of rain water is between 4.61 and 5.26
-signments
(d) What happens to the interval as the level of confidence is changed? Explain why this is a logical result.
signments
This makes sense since
As the level of confidence increases, the width of the interval increases.
including more numbers for consideration makes it more likely one of them is correct.
t Gradeboo
unch
Clear all
Final check
Help me solve this
View an example
Get more help -
0530 Skills fo
ss (MATH 053
ents Only)
Review
Resume
hp
f12,
insert
11
f10
DDI
prt sc
fg
f5
f6
f7
f8
144
DII
f2
f3
f4
&
2
3
7
8.
Expert Solution
This question has been solved!
Explore an expertly crafted, step-by-step solution for a thorough understanding of key concepts.

This is a popular solution!

Trending now
This is a popular solution!

Step by step
Solved in 2 steps with 2 images

Recommended textbooks for you
Glencoe Algebra 1, Student Edition, 9780079039897…
Algebra
ISBN:
9780079039897
Author:
Carter
Publisher:
McGraw Hill
Glencoe Algebra 1, Student Edition, 9780079039897…
Algebra
ISBN:
9780079039897
Author:
Carter
Publisher:
McGraw Hill