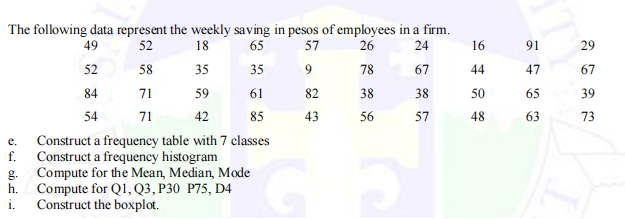
The following data represent the weekly saving in pesos of employees in a firm. 65 49 52 18 57 26 24 16 91 29 52 58 35 35 78 67 44 47 67 84 71 59 61 82 38 38 50 65 39 54 71 42 85 43 56 57 48 63 73 Construct a frequency table with 7 classes f. Construct a frequency histogram Compute for the Mean, Median, Mode g. h. Compute for Q1, Q3, P30 P75, D4 Construct the boxplot. е. i.
The following data represent the weekly saving in pesos of employees in a firm. 65 49 52 18 57 26 24 16 91 29 52 58 35 35 78 67 44 47 67 84 71 59 61 82 38 38 50 65 39 54 71 42 85 43 56 57 48 63 73 Construct a frequency table with 7 classes f. Construct a frequency histogram Compute for the Mean, Median, Mode g. h. Compute for Q1, Q3, P30 P75, D4 Construct the boxplot. е. i.

Glencoe Algebra 1, Student Edition, 9780079039897, 0079039898, 2018
18th Edition
ISBN:9780079039897
Author:Carter
Publisher:Carter
Chapter10: Statistics
Section10.4: Distributions Of Data
Problem 19PFA

Related questions
Question
Please answer letters g,h, & i. Thank you!
Transcribed Image Text:The following data represent the weekly saving in pesos of employees in a firm.
65
49
52
18
57
26
24
16
91
29
52
58
35
35
78
67
44
47
67
84
71
59
61
82
38
38
50
65
39
54
71
42
85
43
56
57
48
63
73
Construct a frequency table with 7 classes
Construct a frequency histogram
Compute for the Mean, Median, Mode
е.
g.
h.
Compute for Q1, Q3, P30 P75, D4
Construct the boxplot.
i.
Expert Solution

Step by step
Solved in 9 steps with 9 images

Recommended textbooks for you
Glencoe Algebra 1, Student Edition, 9780079039897…
Algebra
ISBN:
9780079039897
Author:
Carter
Publisher:
McGraw Hill
Glencoe Algebra 1, Student Edition, 9780079039897…
Algebra
ISBN:
9780079039897
Author:
Carter
Publisher:
McGraw Hill