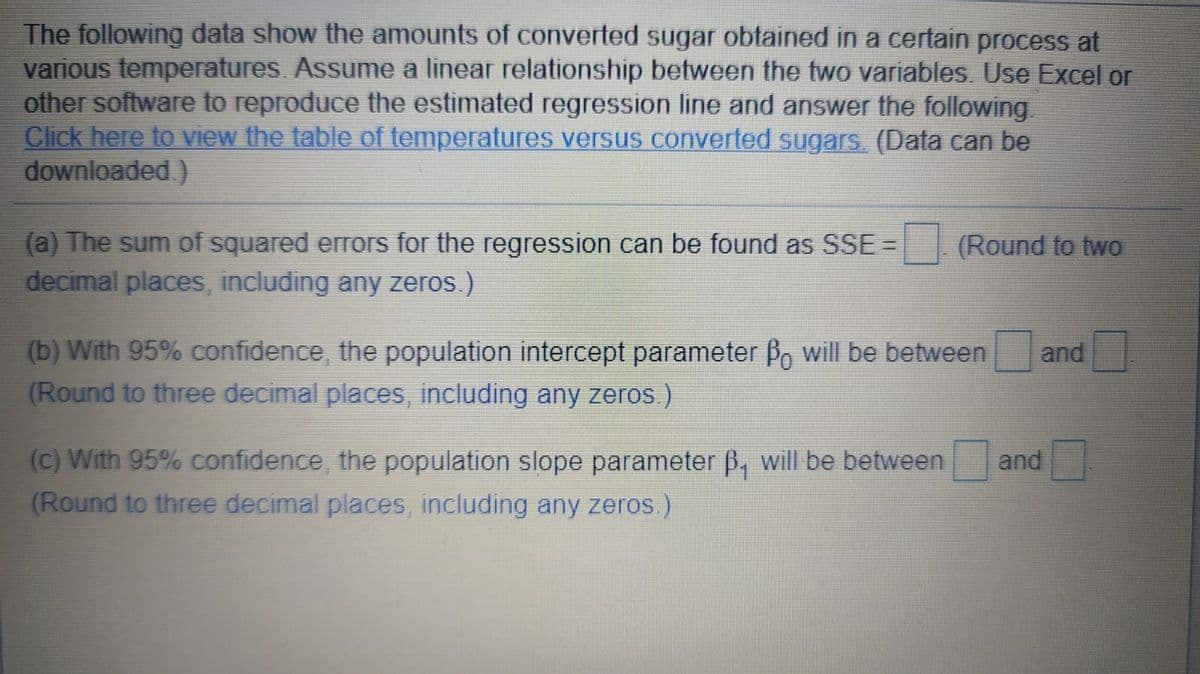
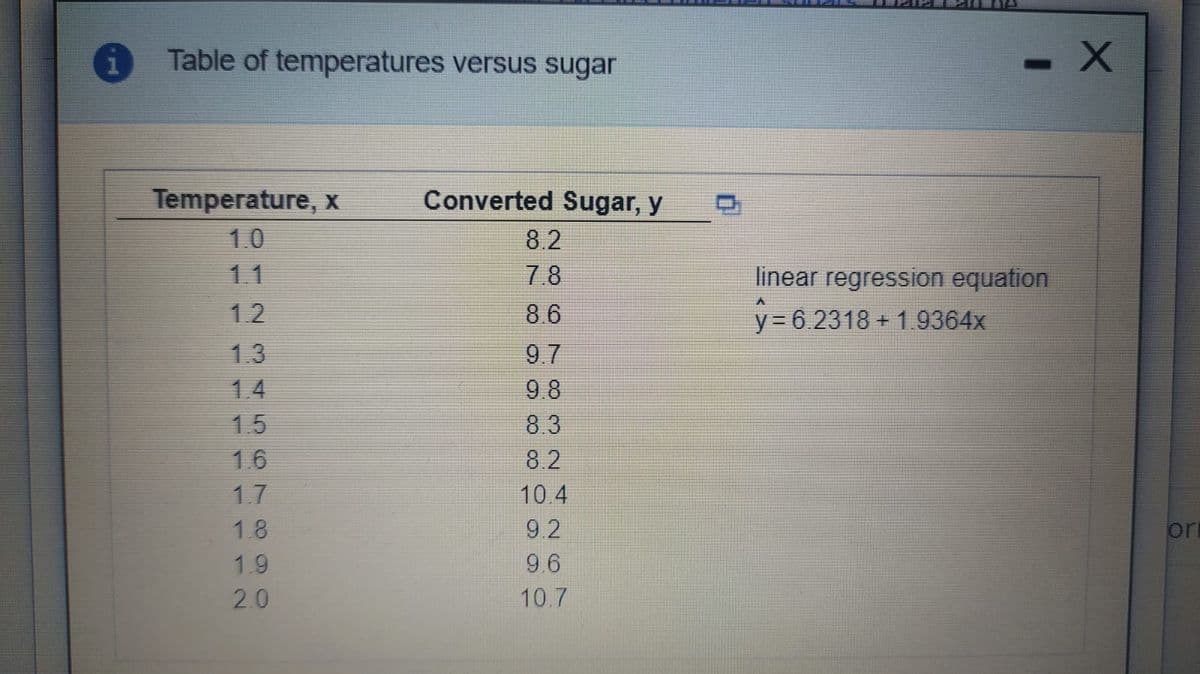
The following data show the amounts of converted sugar obtained in a certain process at various temperatures. Assume a linear relationship between the two variables. Use Excel or other software to reproduce the estimated regression line and answer the following. Click here to view the table of temperatures versus converted sugars. (Data can be downloaded ) (a) The sum of squared errors for the regression can be found as SSE = decimal places, including any zeros.) (Round to two (b) With 95% confidence, the population intercept parameter Bo will be between (Round to three decimal places, including any zeros.) and (c) With 95% confidence, the population slope parameter B, will be between (Round to three decimal places, including any zeros.) and


Correlation
Correlation defines a relationship between two independent variables. It tells the degree to which variables move in relation to each other. When two sets of data are related to each other, there is a correlation between them.
Linear Correlation
A correlation is used to determine the relationships between numerical and categorical variables. In other words, it is an indicator of how things are connected to one another. The correlation analysis is the study of how variables are related.
Regression Analysis
Regression analysis is a statistical method in which it estimates the relationship between a dependent variable and one or more independent variable. In simple terms dependent variable is called as outcome variable and independent variable is called as predictors. Regression analysis is one of the methods to find the trends in data. The independent variable used in Regression analysis is named Predictor variable. It offers data of an associated dependent variable regarding a particular outcome.

Step by step
Solved in 4 steps


