The following data was obtained from 31 days of operation of a plant for the oxidation of ammonia (NH3) to nitric acid (HNO3). The nitric oxides produced are absorbed in a countercurrent absorption tower. The variable observed “daily percent stack loss" is an inverse measure of the over-all efficiency of the plant. The plant is considered to have "excellent performance" on days where the stack loss is less than 10% and it is considered to have “very poor performance" when the stack loss is 28% or higher. The data is: 56 12 43 28 18 18 19 20 10 14 14 13 11 12 9 7889 15 15 18 20 15 12 10 15 28 25 11 14 1. Draw a histogram of the data by hand and show the step to calculate the bar classes. Comment on the shape of the histogram of the sample. 1. Calculate the proportion of days when the plant has excellent performance (stack loss is less than 10% ) or when is it has very poor performance (stack loss 28% or higher). 2. Draw a stem and leaf plot by hand, which digit is the stem?
The following data was obtained from 31 days of operation of a plant for the oxidation of ammonia (NH3) to nitric acid (HNO3). The nitric oxides produced are absorbed in a countercurrent absorption tower. The variable observed “daily percent stack loss" is an inverse measure of the over-all efficiency of the plant. The plant is considered to have "excellent performance" on days where the stack loss is less than 10% and it is considered to have “very poor performance" when the stack loss is 28% or higher. The data is: 56 12 43 28 18 18 19 20 10 14 14 13 11 12 9 7889 15 15 18 20 15 12 10 15 28 25 11 14 1. Draw a histogram of the data by hand and show the step to calculate the bar classes. Comment on the shape of the histogram of the sample. 1. Calculate the proportion of days when the plant has excellent performance (stack loss is less than 10% ) or when is it has very poor performance (stack loss 28% or higher). 2. Draw a stem and leaf plot by hand, which digit is the stem?

Chapter4: Linear Functions
Section: Chapter Questions
Problem 30PT: For the following exercises, use Table 4 which shows the percent of unemployed persons 25 years or...

Related questions
Question
Please answer parts 1 and 2 of the following question (not the histogram part 1, but the part where you calulate the proportion of days...) Thank you
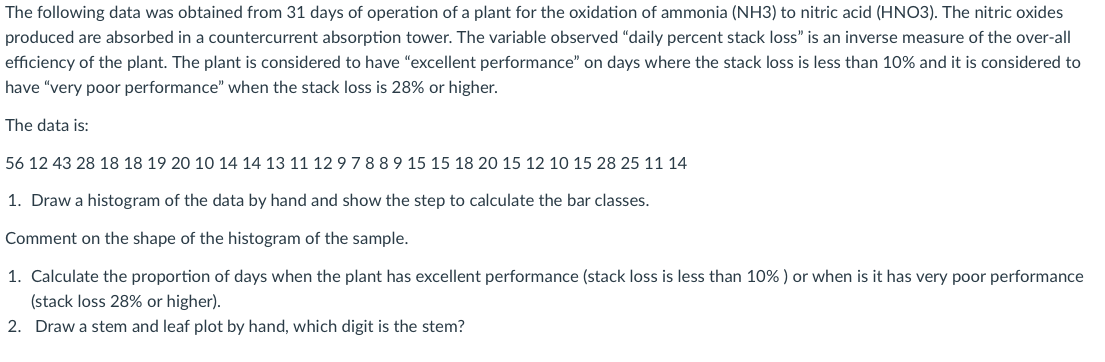
Transcribed Image Text:The following data was obtained from 31 days of operation of a plant for the oxidation of ammonia (NH3) to nitric acid (HNO3). The nitric oxides
produced are absorbed in a countercurrent absorption tower. The variable observed "daily percent stack loss" is an inverse measure of the over-all
efficiency of the plant. The plant is considered to have "excellent performance" on days where the stack loss is less than 10% and it is considered to
have "very poor performance" when the stack loss is 28% or higher.
The data is:
56 12 43 28 18 18 19 20 10 14 14 13 11 1297889 15 15 18 20 15 12 10 15 28 25 11 14
1. Draw a histogram of the data by hand and show the step to calculate the bar classes.
Comment on the shape of the histogram of the sample.
1. Calculate the proportion of days when the plant has excellent performance (stack loss is less than 10% ) or when is it has very poor performance
(stack loss 28% or higher).
2. Draw a stem and leaf plot by hand, which digit is the stem?
Expert Solution
This question has been solved!
Explore an expertly crafted, step-by-step solution for a thorough understanding of key concepts.

This is a popular solution!

Trending now
This is a popular solution!

Step by step
Solved in 2 steps

Recommended textbooks for you

Glencoe Algebra 1, Student Edition, 9780079039897…
Algebra
ISBN:
9780079039897
Author:
Carter
Publisher:
McGraw Hill
Glencoe Algebra 1, Student Edition, 9780079039897…
Algebra
ISBN:
9780079039897
Author:
Carter
Publisher:
McGraw Hill