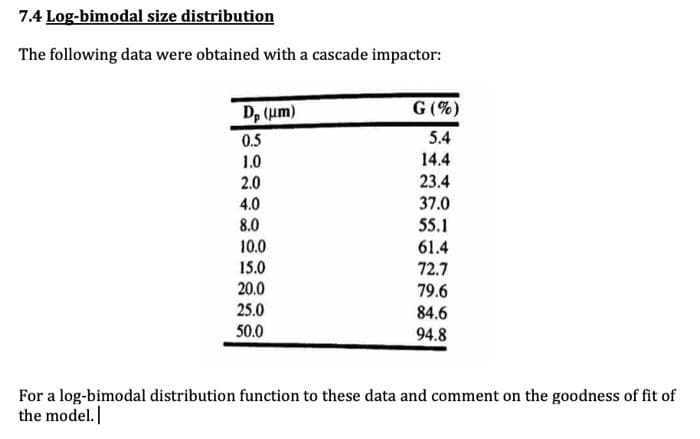
The following data were obtained with a cascade impactor: D, (um) G (%) 0.5 5.4 1.0 14.4 23.4 37.0 55.1 2.0 4.0 8.0


Q: The following data were obtained from a repeated-measure research study. What is the value of MD for…
A: The following data were obtained from a repeated-measure research study What is the value of MD for…
Q: Listed below are duration times (seconds) and time intervals (min) to the next eruption for randomly…
A: The hypotheses are given below: Null hypothesis: H0: ρ= 0 Alternative hypothesis: Ha: ρ ≠ 0 Degrees…
Q: Consider the following model that relates the percentage of a household’s budget spent on milk MK to…
A: ?2 = 2.7648 This implies that a unit increase in the corresponding independent variable leads to an…
Q: Listed below, along with some summary statistics, are amounts of strontium-90 (in millibecquerels…
A: The data is collected from the same group of subjects consecutively for two years. Therefore both…
Q: Below is a scatter plot with both a linear model and an exponential model for another group's data…
A: Note: Hi there! Thank you for posting the question. As your question has more than 3 parts, we have…
Q: An observation that deviates from the pattern in the rest of the data Choose the correct answer…
A: In the following options, a sample that deviates from the rest is given below.
Q: Which of the following study designs is most efficient in studying a rare exposure? A. Case control…
A: Solution-: Which of the following study designs is most efficient in studying a rare exposure?(A)…
Q: part 3 question 5 A college instructor wants to determine if there is a correlation between the…
A: Solution
Q: The following estimator for the population variance (x; – x)² п i=1
A: An estimator is said to be consistent if, as the sample size increases, the sampling distribution of…
Q: Consider the following data. Find the variance. Round your answer to one decimal place.
A: Answer:- Given probability mass function of X x -5 -4 -3 -2 -1 P(X = x) 0.2 0.3 0.2 0.1 0.2…
Q: Based on the regression output, approximately what % of the variance is explained by the regression…
A: Given Multiple R = 0.8299 R square = 0.7511 Adjusted R square = 0.7015 Standard Error = 65.3355…
Q: The data below are from an independent-measures experiment comparing three different treatment…
A:
Q: In which one of the following analyses do we find dx and dy? O a. Karl Pearson's correlation O b.…
A: In regression line we find the value of dX/dy=slope
Q: An experiment measuring the percent shrinkage on drying of a sample of 50 clay specimens produced…
A: Given data, The data is sorted in acending order as follows: 13.4 13.9 14.3 14.8 15.4 15.6 15.8…
Q: Based on the data below, what is the Cronbach's alpha coefficient? Subject Trial 1 Trial 2 1 5 2 2 3…
A: Given problem Given that Based on the data below, The Cronbach's alpha coefficient is = ?…
Q: 1. T/F If I am running a two-way ANOVA and I see that both factors and their interactions are…
A: Introduction: The presence of a significant interaction effect in case of a two-way ANOVA indicates…
Q: The following estimator for the population variance 1 (T; – a)? n i=1 is
A:
Q: Which of the following time series forecasting methods would not be used to forecast seasonal data?
A:
Q: Given the following data, find the weight that represents the 73rd percentile. Weights of Newborn…
A: Given data is8.2,6.6,5.6,6.4,7.9,7.1,6.5,6.0,7.8,8.0,6.8,8.8,9.3,7.7,8.8sample size(n)=15
Q: 13 Find out the likely production corresponding to a rainfall of 40 cms. from the following data :…
A: Regression Equation: When we want to predict the value of one variable, say Y, from the given value…
Q: The data below are from an independent-measures experiment comparing three different treatment…
A:
Q: two most important variables are thought to be the pressure and the temperature. Three levels of…
A: hypothesis null hypothesis :the interaction between pressure and temperature is not significant…
Q: The following data were obtained from a repeated-measures research study. What is the value of Mp…
A: x y d=x-y 10 15 -5 4 8 -4 7 6 1 6 11 -5 Total -13 Here n = 4
Q: The accompanying dataset provides data on monthly unemployment rates for a certain region over four…
A: Using Excel, Find the average of first 3 observation and store it corresponding to 3rd row of the…
Q: A biologist looked at the relationship between number of seeds a plant produces and the percent of…
A: In the given case we need to determine if there exists a statistically significant effect of seeds…
Q: 2. The following figure demonstrate the up-and-down experimental design. Discuss the trend Dose (mg…
A: An up-and-down design is usually used to figure out the dose in any research. For example, in the…
Q: • Example 2: A group of physicians specializing in weight loss is interested in knowing whether…
A:
Q: Here is a POPULATION of scores: 4 2 3 2 1 29. What is the variance for this population of scores?…
A:
Q: As the n and number of samples you take increases, so does the mean none of the above accuracy…
A: Statistics is the branch of applied Mathematics in which we do collection, analysis, interpretation…
Q: The data below are from an independent-measures experiment comparing three different treatment…
A: The following information has been given: Treatment 1 Treatment 2 Treatment 3 0 1 4 0 4 3 0…
Q: Elana evaluated her Pinteret sales for the first quarter of the year and notced that there was one…
A: Given that There was one month where sales were really below other months, pulling her average…
Q: The following data are the duration in minutes of a sample of long-distance phone calls made within…
A: From the provided information, Relative Time (in minutes) Frequency 0 but less than 5…
Q: A band limited white noise has a single sided PSD of 100 over the frequency range of 1 to 26 hz.…
A: Given: Variance of PSD is 100
Q: We are testing whether a particular program of low impact exercise can improve the cholesterol level…
A: Solution: n= 38 Sample size x = ∑xn=266.938=7.0237 Sample mean s= ∑(x-x)2n-1s =1.6480 Sample…
Q: Interpret the results presented in the following table. Table 2: Descriptive Analysis Cronbach Mean…
A: Skewness: If the value of skewness is equal to zero then the distribution is normal and symmetric.…
Q: Below are the percentages of the popular vote won by the successful candidate in each of the…
A: A data can be raw or grouped, with some pro and cons associated with both of them. The raw data has…
Q: 3. The following table shows the onset of obesity (BMI of 30 kg/m2 or more) in Philadelphia after 30…
A: Relative risk is the ratio of the risks for an event for the exposure group to the risks for the…
Q: A band limited white noise has a single sided PSD of 100 over the frequency range of 1 to 26 hz.…
A: Given : White noise has a single sided PSD of 100 over frequency range of 1 to 26 hz. PSD = 100
Q: consider the following table 4 20 10 2 8 10 4 the Pearson correlation coefficient =
A: The Pearson Coefficient formula is, r = n∑xy-∑x∑yn∑x2-∑x2n∑y2-∑y2 By putting all the values in the…
Q: Listed below are the percent tips given when a restaurant bill contains a bad weather report on the…
A:
Q: The following data are from a repeated-measures study comparing two treatment conditions. Complete…
A: Given, the repeated-measure study comparing two treatment conditions. No. of observation n=6 xi…
Q: You are observing the speeds of two CPUs, to find which one is expected to run faster. After a…
A: Use the given data to form a table: Speed CPU 1(F1) CPU 2(F2) Speed (x) x*F1 x*F2 2.0 to 2.4 15…
Q: a) In the manufacturing of plastic material, it is believed that the cooling time (in seconds) has…
A:
Q: The following data give the weights (in pounds) lost by 15 members of a health club at the end of 2…
A: According to our guidelines we can answer only one question at a time. Kindly re-post other…
Q: The following table reports the sale of umbrellas for 16 quarters. Year 1 Year 2 Year 3 Year 4…
A: When we want to estimate an impact of many variables on the one variable at that time we…
Q: Question 2 What is the cumulative error for the WMA3 forecast? (remember. weights are 0.5. 0.33, and…
A: Exponential Smoothing is a type of Moving averages forecasting technique that weights past data in…
Q: State whether the effect size for a 1-point effect (M- = 1) is small, medium or large given the…
A: Effect size is: Effect size=M-μσ=1σ
Q: Analysis of several plant-food preparations for potassium ion yielded the following data: Sample…
A: b. Use the DEVSQ( ) function to find the sum of squares of the deviations for each sample, then the…


Trending now
This is a popular solution!

Step by step
Solved in 3 steps with 1 images

- What does the y -intercept on the graph of a logistic equation correspond to for a population modeled by that equation?Olympic Pole Vault The graph in Figure 7 indicates that in recent years the winning Olympic men’s pole vault height has fallen below the value predicted by the regression line in Example 2. This might have occurred because when the pole vault was a new event there was much room for improvement in vaulters’ performances, whereas now even the best training can produce only incremental advances. Let’s see whether concentrating on more recent results gives a better predictor of future records. (a) Use the data in Table 2 (page 176) to complete the table of winning pole vault heights shown in the margin. (Note that we are using x=0 to correspond to the year 1972, where this restricted data set begins.) (b) Find the regression line for the data in part ‚(a). (c) Plot the data and the regression line on the same axes. Does the regression line seem to provide a good model for the data? (d) What does the regression line predict as the winning pole vault height for the 2012 Olympics? Compare this predicted value to the actual 2012 winning height of 5.97 m, as described on page 177. Has this new regression line provided a better prediction than the line in Example 2?A group of six, obese adult men had their weights recorded both before and 10 months after having a diet treatment to help manage their weight. Observe the information presented in the table below: The weights of six obese adult men both before and 10-months after having a diet treatment Before Diet Treatment After Diet Treatment 250 240 225 215 220 198 311 300 326 298 205 205 Test at α = 0.05 the hypothesis that for the group, there was a statistically significant average decrease in weight from before diet treatment to 10 months after. Hint: This is hypothesis testing for paired samples. Here, you will use a paired t test.
- The owner of Showtime Movie Theaters, Inc., would like to predict weekly gross revenue as a function of advertising expenditures. Historical data for a sample of eight weeks follow. Weekly Gross Revenue ($1000s) Televison Advertising ($1000s) Newspaper Advertising ($1000s) 97 6 1.5 90 2 2 95 5 1.5 93 3.5 2.5 95 3 4.3 95 3.5 3.3 95 3.5 4.2 95 4 2.5 a. Use alpha= 0.01 to test the hypotheses Ho : Beta Sub1= Beta Sub2 =0 Ha : Beta Sub1 and/or Beta Sub2 is not equal to zero for the model y=Beta Sub 0+ Beta Sub1 Xsub1+Beta Sub2 Xsub2+E , where X1= television advertising ($1000s) X2+ newspaper advertising ($1000s) Compute the F test statistic (to 2 decimals). Use F table. What is the p-value? - Select your answer -less than .01between .01 and .025between .025 and .05between .05 and .10greater than .10Item 2 What is your conclusion? - Select your answer -The overall model is not significantThe overall model is significantItem 3 b. Use alpha =0.05 to…Draw a scatter diagram for the data and determine by inspection if there exists an approximate linear relationship between Y and X. Approximately draw a straight-line between the plotted values. State the general relationship between Y and disposable X in1.exact linear form 2. stochastic form.Demand for haircut at PogiPoints Barber Shop has increased steadily for the past few months as seen in the following time series data. Do the necessary computations and choose the best answer that would complete each statement. With MAD as the criterion, the best forecasting model for this time series data is: * A.)Naïve approach B.)2-week SMA C).WMA with weights: 0.5, 0.3, 0.2 D). D. ES with alpha = 0.8
- The type of battery in Jim's laptop has a lifetime X (in years) which follows a Weibull distribution with parameters α=2 and β=4. The type of battery in Jim's tablet has a lifetime Y (in years) which follows an exponential distribution with parameter λ=1/4.Find E(XY−2Y).(Answer as a decimal number, and round to 2 decimal places).As a bonus assignment a former student checked if your professor gave a statisticallysignificant difference in grades between his male and female students. She based herstudy based on grades assigned in intermediate Econ courses (Econ 303, 305 and 317)and her sample included nm = 485 male students and nf = 264 female students. Theaverage grades received were xm = 84.6 and xf = 85.8 The population standad deviation were σ m = 12.0 and σ f = 11.4 8. From the same extra-credit study as in question 7 see above, this former student found that the proportion of female students in principle courses (Econ 203, 205) was ?̅? = 0.380, while the proportion of female students in intermediate courses (Econ 303, 305, 317) was ?̅? = 0.352. The principle courses sample size was np = 782, while the intermediate courses sample size was ni = 749. Test the hypothesis that female students are less in intermediate courses using a 90% confidence level and the p-value approach.The body mass index (BMI) of a person is defined to be the person’s body mass divided by the square of the person’s height. The article “Influences of Parameter Uncertainties within the ICRP 66 Respiratory Tract Model: Particle Deposition” (W. Bolch, E. Farfan, et al., Health Physics, 2001:378–394) states that body mass index (in kg/m²) in men aged 25–34 is lognormally distributed with parameters μ = 3.215 and σ = 0.157. a) Find the mean BMI for men aged 25–34. b) Find the standard deviation of BMI for men aged 25–34. c) Find the median BMI for men aged 25–34. d) What proportion of men aged 25–34 have a BMI less than 22? e) Find the 75th percentile of BMI for men aged 25–34.
- Suppose your dependent variable is aggregate household demand for electricity for various cities. To correct for heteroskedasticity you should Select one: a. multiply observations by the square root of the city size b. multiply observations by the city size c. divide observations by the city size d. divide observations by the square root of the city size e. none of theseBelow is the SPSS output for the relationship between height at age 3 (X) and at age 20 (Y). Correlations heightAt3 heightAt20 heightAt3 Pearson Correlation 1 .840** Sig. (2-tailed) .000 N 16 16 heightAt20 Pearson Correlation .840** 1 Sig. (2-tailed) .000 N 16 16 **. Correlation is significant at the 0.01 level (2-tailed). ANOVAa Model Sum of Squares df Mean Square F Sig. 1 Regression 236.838 1 236.838 33.628 .000b Residual 98.599 14 7.043 Total 335.438 15 Dependent Variable: heightAt20 Predictors: (Constant), heightAt3 Coefficientsa Model Unstandardized Coefficients Standardized Coefficients t Sig. B Std. Error Beta 1 (Constant) 41.679 4.470 9.325 .000 heightAt3 .664 .114 .840 5.799 .000 Dependent Variable: heightAt20 State hypothesis for the…Suppose your dependent variable is crime rates for various cities. To correct for heteroskedasticity you should Select one: a. multiply observations by the city size b. multiply observations by the square root of the city size c. none of these d. divide observations by the square root of the city size e. divide observations by the city size


