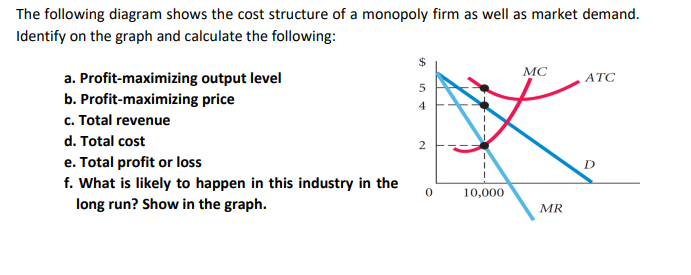
The following diagram shows the cost structure of a monopoly firm as well as market demand. Identify on the graph and calculate the following: a. Profit-maximizing output level MC ATC b. Profit-maximizing price c. Total revenue d. Total cost 2 e. Total profit or loss f. What is likely to happen in this industry in the long run? Show in the graph. 10,000 MR
The following diagram shows the cost structure of a monopoly firm as well as market demand. Identify on the graph and calculate the following: a. Profit-maximizing output level MC ATC b. Profit-maximizing price c. Total revenue d. Total cost 2 e. Total profit or loss f. What is likely to happen in this industry in the long run? Show in the graph. 10,000 MR

Chapter13: Monopoly And Antitrust
Section: Chapter Questions
Problem 7P

Related questions
Question
100%
ASAP!!
Transcribed Image Text:The following diagram shows the cost structure of a monopoly firm as well as market demand.
Identify on the graph and calculate the following:
$
MC
a. Profit-maximizing output level
b. Profit-maximizing price
c. Total revenue
ATC
4
d. Total cost
e. Total profit or loss
f. What is likely to happen in this industry in the
long run? Show in the graph.
10,000
MR
%24
2.
Expert Solution
This question has been solved!
Explore an expertly crafted, step-by-step solution for a thorough understanding of key concepts.

This is a popular solution!

Trending now
This is a popular solution!

Step by step
Solved in 2 steps

Knowledge Booster


Learn more about
Need a deep-dive on the concept behind this application? Look no further. Learn more about this topic, economics and related others by exploring similar questions and additional content below.Recommended textbooks for you
Exploring Economics
Economics
ISBN:
9781544336329
Author:
Robert L. Sexton
Publisher:
SAGE Publications, Inc


Exploring Economics
Economics
ISBN:
9781544336329
Author:
Robert L. Sexton
Publisher:
SAGE Publications, Inc

Principles of Economics 2e
Economics
ISBN:
9781947172364
Author:
Steven A. Greenlaw; David Shapiro
Publisher:
OpenStax


Economics (MindTap Course List)
Economics
ISBN:
9781337617383
Author:
Roger A. Arnold
Publisher:
Cengage Learning