The following estimated regression equation based on 30 observations was presented. ŷ = 17.6 + 3.8x,1 - 2.3x2 + 7.6x3 + 2.7x4 %3D | The values of SST and SSR are 1,804 and 1,779, respectively. (a) Compute R?. (b) Compute R,. (c) Comment on the goodness of fit.
The following estimated regression equation based on 30 observations was presented. ŷ = 17.6 + 3.8x,1 - 2.3x2 + 7.6x3 + 2.7x4 %3D | The values of SST and SSR are 1,804 and 1,779, respectively. (a) Compute R?. (b) Compute R,. (c) Comment on the goodness of fit.

Functions and Change: A Modeling Approach to College Algebra (MindTap Course List)
6th Edition
ISBN:9781337111348
Author:Bruce Crauder, Benny Evans, Alan Noell
Publisher:Bruce Crauder, Benny Evans, Alan Noell
Chapter5: A Survey Of Other Common Functions
Section5.6: Higher-degree Polynomials And Rational Functions
Problem 1TU: The following fictitious table shows kryptonite price, in dollar per gram, t years after 2006. t=...

Related questions

Question
R5
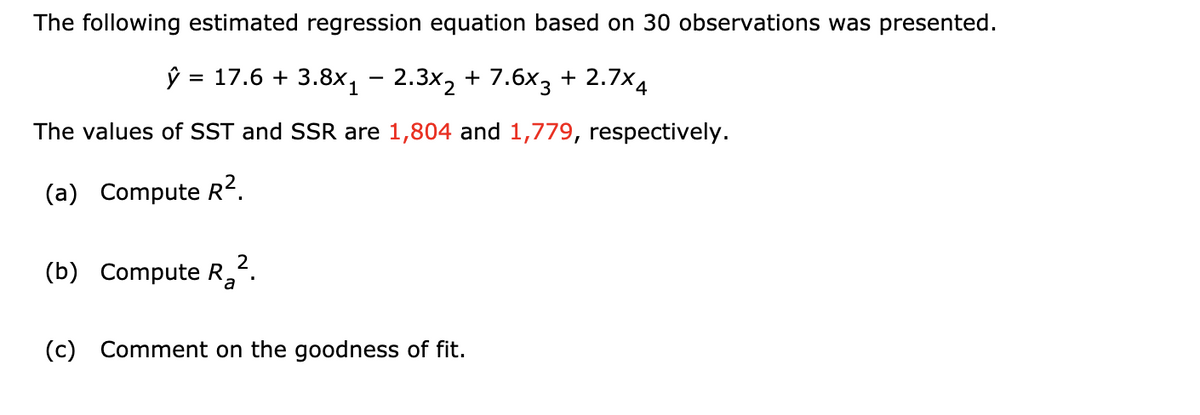
Transcribed Image Text:The following estimated regression equation based on 30 observations was presented.
ŷ = 17.6 + 3.8x, - 2.3x2 + 7.6x3 + 2.7×4
The values of SST and SSR are 1,804 and 1,779, respectively.
(a) Compute R2.
2
(b) Compute R,
(c) Comment on the goodness of fit.
Expert Solution
This question has been solved!
Explore an expertly crafted, step-by-step solution for a thorough understanding of key concepts.

Step by step
Solved in 2 steps with 2 images

Knowledge Booster


Learn more about
Need a deep-dive on the concept behind this application? Look no further. Learn more about this topic, statistics and related others by exploring similar questions and additional content below.Recommended textbooks for you
Functions and Change: A Modeling Approach to Coll…
Algebra
ISBN:
9781337111348
Author:
Bruce Crauder, Benny Evans, Alan Noell
Publisher:
Cengage Learning

Glencoe Algebra 1, Student Edition, 9780079039897…
Algebra
ISBN:
9780079039897
Author:
Carter
Publisher:
McGraw Hill

College Algebra
Algebra
ISBN:
9781305115545
Author:
James Stewart, Lothar Redlin, Saleem Watson
Publisher:
Cengage Learning
Functions and Change: A Modeling Approach to Coll…
Algebra
ISBN:
9781337111348
Author:
Bruce Crauder, Benny Evans, Alan Noell
Publisher:
Cengage Learning
Glencoe Algebra 1, Student Edition, 9780079039897…
Algebra
ISBN:
9780079039897
Author:
Carter
Publisher:
McGraw Hill
College Algebra
Algebra
ISBN:
9781305115545
Author:
James Stewart, Lothar Redlin, Saleem Watson
Publisher:
Cengage Learning