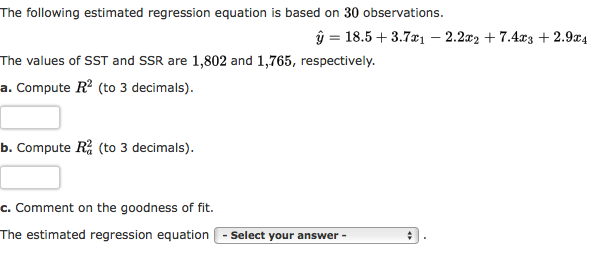
The following estimated regression equation is based on 30 observations. ŷ = 18.5 + 3.7x1 – 2.2x2 + 7.4x3 + 2.9x4 The values of SST and SSR are 1,802 and 1,765, respectively. a. Compute R² (to 3 decimals). b. Compute R (to 3 decimals). c. Comment on the goodness of fit. The estimated regression equation - Select your answer -


Q: Based on the data shown below, calculate the regression line (each value to two decimal places) y% =…
A: The required regression equation of Y on X is, y=a+bxwhere,a=y-interceptb=slope of the…
Q: The following estimated regression equation based on 30 observations was presented. ŷ = 17.6 +…
A: (a) Obtain the value of r square. The value of r square is obtained below as follows: From the…
Q: Answer the following questions on the basis of the following regression equation. (Standard errors…
A: For variable PA: The degrees of freedom is, df=n-p-1=200-4-1=195 The degrees of freedom is 195.…
Q: Use the given data to find the equation of the regression line. Round the final values to three…
A:
Q: The following regression output is for predicting the heart weight (in g) of cats from their body…
A: From the output, the slope is 4.034 and the intercept is -0.357.
Q: The exercise involving data in this and subsequent sections were designed to be solved using Excel.…
A:
Q: The following table contains data regarding golf scores and the average lengths of drives (in yards)…
A: From the statistical software we get the output as follows,
Q: The following estimated regression equation based on 10 observations was presented. ý = 29.1260 +…
A: Given : n = 10 y^=29.1260+0.5105x1+0.4680x2SST=6715.125SSR=6229.375We want find,SSE=?R2=?Ra2=?
Q: Based on the data shown below, calculate the regression line (each value to two decimal places) y =…
A:
Q: Given the following data n=5. Σ x= 15, Σ (X - Χ:-10, Σ (r - )' = 25. Σ (X - ΣΧΥ-7- 3 Compute the…
A: Given: n=5, ∑x=15, ∑y=20, ∑x-x2=10, ∑y-y2=26 and ∑x-xy-y=13. Then,x=∑xn=155=3y=∑yn=205=4
Q: Run a regression analysis on the following data set, where yy is the final grade in a math class and…
A:
Q: The following estimated regression equation is based on 30 observations. ŷ = 18.3 + 3.9x1 − 2.2x2 +…
A: I have given an answer in step 2.
Q: The following estimated regression equation is based on 30 observations. ŷ = 18.5 +4x1- 2.4x2 +…
A: From the provided information, Number of observations (n) = 30 Number of independent variable (k) =…
Q: An agent for a real estate company in a large city would like to be able to predict the monthly…
A: Enter the given data into the excel as follows:
Q: By using the following data, fit an equation of multiple linear regression to estimate the value of…
A: Given data: Y X1 X2 3 4 4 6 6 3 4 5 5 3 3 3 2 6 2
Q: The exercise involving data in this and subsequent sections were designed to be solved using Excel.…
A: given n = 30 observation y⏞ =17.2 +3.6 x1 - 2.2x2 + 7.8 x3 -2.9x4 The values of SST and SSR are…
Q: Consider the regession equation: d6 gb gs(e)e where -the average diference between the monthly…
A:
Q: he following estimated regression equation is based on 10 observations was presented. ere SST…
A: SSR 6016.125 SST 6718.875 n 10 sb1 0.0861 sb2 0.0531 The regression equations:…
Q: Consider the following estimated regression equation: y' = 5.2 - 10.3x If (x = 10, y = -100) was one…
A:
Q: Determine the regression equation for the following questions using the existing methods 10 15 22,5…
A: Given data is x 10 15 22.5 33.7 50.65 75.9 y 0.3 0.675 1.519 3.417 7.689 17.3
Q: This data was used to develop an estimated regression equation, ý = 1,405.33 + 7.44x, relating…
A: The null and alternative hypothesis is given below:
Q: The following estimated regression equation based on 10 observations was presented. 9 = 22.1270 +…
A: Since you have asked multiple sub parts of the question, we will solve first three sub parts for…
Q: A factory estimated the relationship between the number of labor hours (Independent) and the number…
A:
Q: From the following data, determine if the data has a positive or a negative relationship with each…
A: We want to find correlation coefficient and regression equation
Q: The following estimated regression equation relating sales to inventory investment and advertising…
A: Solution: Given information: n= 10 observation k= 2 independent variable Sum of square of total =…
Q: A sample of X and Y scores is taken, and a regression line is used to predict Y from X. If SSY' =…
A: Given information- We have given sample of X and Y scores. We have to predict Y from X using…
Q: Find the regression coefficient of y on x from the following regression equations. 5x 22 +y 64 x 24+…
A:
Q: A sample of 168 generated the following regression equation :Y = bo +b}X, +b2X2+b3X3+b4X4. The…
A: We have to find given degree of freedom.
Q: Give the following data: X 6 2 10 4 8 Y 9 11 5 8 7 Find the two regression equations and calculate…
A:
Q: Run a regression analysis on the following data set, where yy is the final grade in a math class and…
A: It was stated to run regression analysis on the following data set. y is the final grade in a math…
Q: For each of the following data sets: plot the data, determine the regression equation, and add the…
A:
Q: Use the given data to find the equation of the regression line. Round the final values to three…
A: The following data is given: X Y 0 8 3 2 4 6 5 9 12 12 The independent variable is…
Q: The following estimated regression equation based on 30 observations was presented. ŷ = 17.6 + 3.8x,…
A: Given that Regression equation With k=5 independent variables (including intercept) n=30 SST=1807…
Q: The following estimated regression equation based on 10 observations was presented. 9 = 29.1240 +…
A: From the provided information, SST = 6721.125 and SSR = 6215.375 b) The required value of R2 can be…
Q: With the following data find the regression equation for the prediction of college GPA by the number…
A: Enter the given data into the excel as follows:
Q: Run a regression analysis on the following data set, where yy is the final grade in a math class and…
A: The variable x shows the hours and y shows the week grade.
Q: The following estimated regression equation based on 30 observations was presented. ŷ = 17.6 + 3.8x1…
A: (a) The values of SST and SSR are 1,807 and 1,757, respectively. The value of R2 is,…
Q: The following estimated regression equation based on 10 observations was presented. ŷ = 29.1260 +…
A: Hello! As you have posted 4 sub parts, we are answering the first 3 sub-parts. In case you require…
Q: In a regression analysis involving 27 observations, the following estimated regressionequation was…
A:
Q: The admissions officer for Clearwater College developed the following estimated regression equation…
A: The admissions officer for Clearwater College developed the following estimated regression equation…
Q: The following table shows the annual expenditures, in dollars, per customer unit for residential…
A: Given: The following table shows the annual expenditures, in dollars, per residential landline phone…
Q: Run a regression analysis on the following data set, where yy is the final grade in a math class and…
A: Given the data of the final grade in a math class and the average number of hours the student spent…
Q: Calculate the estimated multiple linear regression equation for the following data using the…
A: Regression measures linear relationship between independent variables(explanatory variable) and…
Q: Q#2: (a) Calculate the estimated multiple linear regression equation for the following data using…
A: Given : ∑y=89,∑x1=30,∑x2=52,∑x12=238,∑x22=582, ∑x1y = 619,∑x1x2=351,∑x2y=1007,n=5
Q: Using the same set of data as questions 4 and 5, what would be the "a" coefficient be if we force…
A: Regression expresses the relationship between variables in the form of equation. Y=a+bX where,…
Q: Run a regression analysis on the following data set, where yy is the final grade in a math class and…
A:
Q: The following estimated regression equation is based on 30 observations. ŷ = 17.3 + 3.7x1 – 2x2 +…
A: a. The coefficient of determination is, R2=1-SSRSST=1-17551803=1-0.973=0.027 Thus, the value of R2…
Q: The admissions officer for a certain college developed the following estimated regression equation…
A: As the multiple linear regression equation is given by, ŷ = −1.39 + 0.0234x1 + 0.00482x2 where A…
Q: Given are five observations for two variables, x and y. xi 1 2 3 4 5 yi 4 5 5 10 14 Which of the…
A: Use EXCEL to construct the scatter plot. EXCEL procedure: Go to EXCEL Go to Insert menu…


Trending now
This is a popular solution!

Step by step
Solved in 2 steps with 1 images

- The following fictitious table shows kryptonite price, in dollar per gram, t years after 2006. t= Years since 2006 0 1 2 3 4 5 6 7 8 9 10 K= Price 56 51 50 55 58 52 45 43 44 48 51 Make a quartic model of these data. Round the regression parameters to two decimal places.The following estimated regression equation based on 30 observations was presented. ŷ = 17.6 + 3.8x1 − 2.3x2 + 7.6x3 + 2.7x4 The values of SST and SSR are 1,808 and 1,780, respectively. (a) Compute R2. (b) Compute Ra2. (c) Comment on the goodness of fit.The following estimated regression equation is based on 30 observations. y=17.4 - 4.0x 1- 2.3x2 +7.3x32.9x4 The values of SST and SSR are 1,808 and 1,760, respectively. Compute R2 (to 3 decimals). Compute Ra2 (to 3 decimals). How good is the fit provided by the estimated regression equation?
- The following estimated regression equation is based on 30 observations. ŷ = 18.3 + 3.9x1 − 2.2x2 + 7.5x3 + 2.5x4 The values of SST and SSR are 1,805 and 1,762, respectively. a. Compute R2 = (to 3 decimals). b. Compute Ra2 = (to 3 decimals).Using this regression equation, Ŷ = .45X+ 9, find the SSresidual you would need to calculate the standard error of the estimate. X Y 15 3 12 6 17 2 11 5The following estimated regression equation based on 10 observations was presented. ŷ = 29.1260 + 0.5306x1 + 0.4680x2 The values of SST and SSR are 6,728.125 and 6,215.375, respectively. (a) Find SSE. SSE = (b) Compute R2. (Round your answer to three decimal places.) R2 = (c) Compute Ra2. (Round your answer to three decimal places.) Ra2 = (d) Comment on the goodness of fit. (For purposes of this exercise, consider a proportion large if it is at least 0.55.) The estimated regression equation provided a good fit as a small proportion of the variability in y has been explained by the estimated regression equation.The estimated regression equation did not provide a good fit as a small proportion of the variability in y has been explained by the estimated regression equation. The estimated regression equation provided a good fit as a large proportion of the variability in y has been explained by the estimated regression equation.
- The following estimated regression equation based on 30 observations was presented. ŷ = 17.6 + 3.8x1 − 2.3x2 + 7.6x3 + 2.7x4 The values of SST and SSR are 1,807 and 1,757, respectively. (a) Compute R2. (Round your answer to three decimal places.) R2 = (b) Compute Ra2. (Round your answer to three decimal places.) Ra2 = (c) Comment on the goodness of fit. (For purposes of this exercise, consider a proportion large if it is at least 0.55.) The estimated regression equation did not provide a good fit as a large proportion of the variability in y has been explained by the estimated regression equation. The estimated regression equation provided a good fit as a large proportion of the variability in y has been explained by the estimated regression equation. The estimated regression equation provided a good fit as a small proportion of the variability in y has been explained by the estimated regression equation. The estimated regression equation did not provide a good…The following estimated regression equation based on 30 observations was presented. ŷ = 17.6 + 3.8x1 − 2.3x2 + 7.6x3 + 2.7x4 The values of SST and SSR are 1,801 and 1,758, respectively. (a)Compute R2. (Round your answer to three decimal places.) R2 = (b)Compute Ra2.(Round your answer to three decimal places.) Ra2 = (c) Comment on the goodness of fit. (For purposes of this exercise, consider a proportion large if it is at least 0.55.) The estimated regression equation provided a good fit as a small proportion of the variability in y has been explained by the estimated regression equation.The estimated regression equation did not provide a good fit as a large proportion of the variability in y has been explained by the estimated regression equation. The estimated regression equation did not provide a good fit as a small proportion of the variability in y has been explained by the estimated regression equation.The estimated regression equation provided a good fit as a…The following multiple regression printout can be used to predict a person's average annual salary given his or her years of employment and number of years of education beyond high school. Regression Analysis: Salary Versus YrsEm, Educ Coefficients Term Coef SE Coef T-Value P-Value Constant 23,175 1,771 13.09 0.000 YrsEm 671 141 4.76 0.000 Educ 1,911 378 5.06 0.000 (a) Is the regression coefficient of education (Educ) statistically significant? (Use ? = 0.05.) Given this output, the regression coefficient for education (is/is not) statistically significant. (b) Does the variable education belong in the model? Given this output, the variable education (may/may not) belong in the model. (c) Given this output, which of the following is the correct interpretation for Education in this model? -For each additional year of education beyond high school, the estimated change in the average annual salary is $23,175, controlling for years of employment. -For each…
- Run a regression analysis on the following data set, where yy is the final grade in a math class and xx is the average number of hours the student spent working on math each week. hours/weekx Gradey 5 59 6 54.4 6 56.4 8 59.2 11 68.4 12 78.8 13 75.2 14 89.6 14 89.6 16 87.4 State the regression equation y=m⋅x+by=m⋅x+b, with constants accurate to two decimal places. What is the predicted value for the final grade when a student spends an average of 15 hours each week on math?Grade = Round to 1 decimal place.Consider the set of ordered pairs shown below. Assuming that the regression equation is y= 2.814 + 0.406x and the SSE = 5.313, construct a 90% prediction interval for x= 3. x 6 0 4 4 4 2 y 5 3 6 5 3 3 Calculate the upper and lower limits of the prediction interval. UPL=LPL= Someone please help me solve this! Thank you!Consider the following data on x = weight (pounds) and y = price ($) for 10 road-racing bikes. These data provided the estimated regression equation ŷ = 28,240 − 1,419x. For these data, SSE = 7,209,342.96 and SST = 50,969,800. Use the F test to determine whether the weight for a bike and the price are related at the 0.05 level of significance. -Find the value of the test statistic. (Round your answer to two decimal places.)
