The following graph contains four lines (A, B, C and D), each of which has a slope that is either positive, negative, zero, or infinite. For each of the following scenarios, indicate whether the relationship between the two variables is positive or negative, as well as which line on the previous graph has a slope that reflects this type of relationship. Hint: The X-axis and Y-axis on the graph are not labeled intentionally. You need to substitute the variables from each scenario for the horizontal and vertical axis. For example, in the first scenario, X-axis should be labeled “ The average grade received" and Y-axis should be labeled "The number of hours spent studying". Scenario: As the number of hours spent studying rises, the average grade received rises. Relationship: Positive or Negative Line: A, B, C, or D? Scenario: As the number of hours spent watching TV rises, the average grade received falls. Relationship: Positive or Negative Line: A, B, C, or D? Scenario: As the number of hours spent studying falls, the likelihood of getting an A falls. Relationship: Positive or Negative Line: A, B, C, or D?
The following graph contains four lines (A, B, C and D), each of which has a slope that is either positive, negative, zero, or infinite. For each of the following scenarios, indicate whether the relationship between the two variables is positive or negative, as well as which line on the previous graph has a slope that reflects this type of relationship. Hint: The X-axis and Y-axis on the graph are not labeled intentionally. You need to substitute the variables from each scenario for the horizontal and vertical axis. For example, in the first scenario, X-axis should be labeled “ The average grade received" and Y-axis should be labeled "The number of hours spent studying". Scenario: As the number of hours spent studying rises, the average grade received rises. Relationship: Positive or Negative Line: A, B, C, or D? Scenario: As the number of hours spent watching TV rises, the average grade received falls. Relationship: Positive or Negative Line: A, B, C, or D? Scenario: As the number of hours spent studying falls, the likelihood of getting an A falls. Relationship: Positive or Negative Line: A, B, C, or D?

Principles of Economics 2e
2nd Edition
ISBN:9781947172364
Author:Steven A. Greenlaw; David Shapiro
Publisher:Steven A. Greenlaw; David Shapiro
Chapter6: Consumer Choices
Section: Chapter Questions
Problem 13CTQ: Think back to a purchase that you made recently. How would you describe your thinking before you...

Related questions
Question
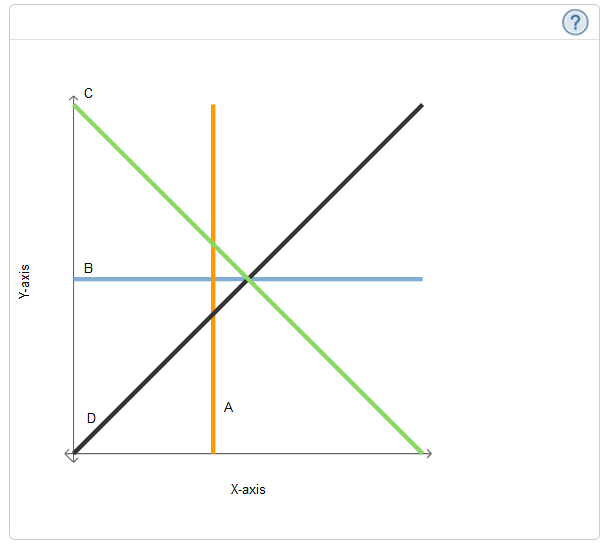
The following graph contains four lines (A, B, C and D), each of which has a slope that is either positive, negative, zero, or infinite.
For each of the following scenarios, indicate whether the relationship between the two variables is positive or negative, as well as which line on the previous graph has a slope that reflects this type of relationship.
Hint: The X-axis and Y-axis on the graph are not labeled intentionally. You need to substitute the variables from each scenario for the horizontal and vertical axis. For example, in the first scenario, X-axis should be labeled “ The average grade received" and Y-axis should be labeled "The number of hours spent studying".
Scenario: As the number of hours spent studying rises, the average grade received rises.
Relationship: Positive or Negative
Line: A, B, C, or D?
Scenario: As the number of hours spent watching TV rises, the average grade received falls.
Relationship: Positive or Negative
Line: A, B, C, or D?
Scenario: As the number of hours spent studying falls, the likelihood of getting an A falls.
Relationship: Positive or Negative
Line: A, B, C, or D?
Transcribed Image Text:В
A
D
Х-аxis
Y-ахis
Expert Solution
This question has been solved!
Explore an expertly crafted, step-by-step solution for a thorough understanding of key concepts.

This is a popular solution!

Trending now
This is a popular solution!

Step by step
Solved in 2 steps

Knowledge Booster


Learn more about
Need a deep-dive on the concept behind this application? Look no further. Learn more about this topic, economics and related others by exploring similar questions and additional content below.Recommended textbooks for you
Principles of Economics 2e
Economics
ISBN:
9781947172364
Author:
Steven A. Greenlaw; David Shapiro
Publisher:
OpenStax
Principles of Economics 2e
Economics
ISBN:
9781947172364
Author:
Steven A. Greenlaw; David Shapiro
Publisher:
OpenStax