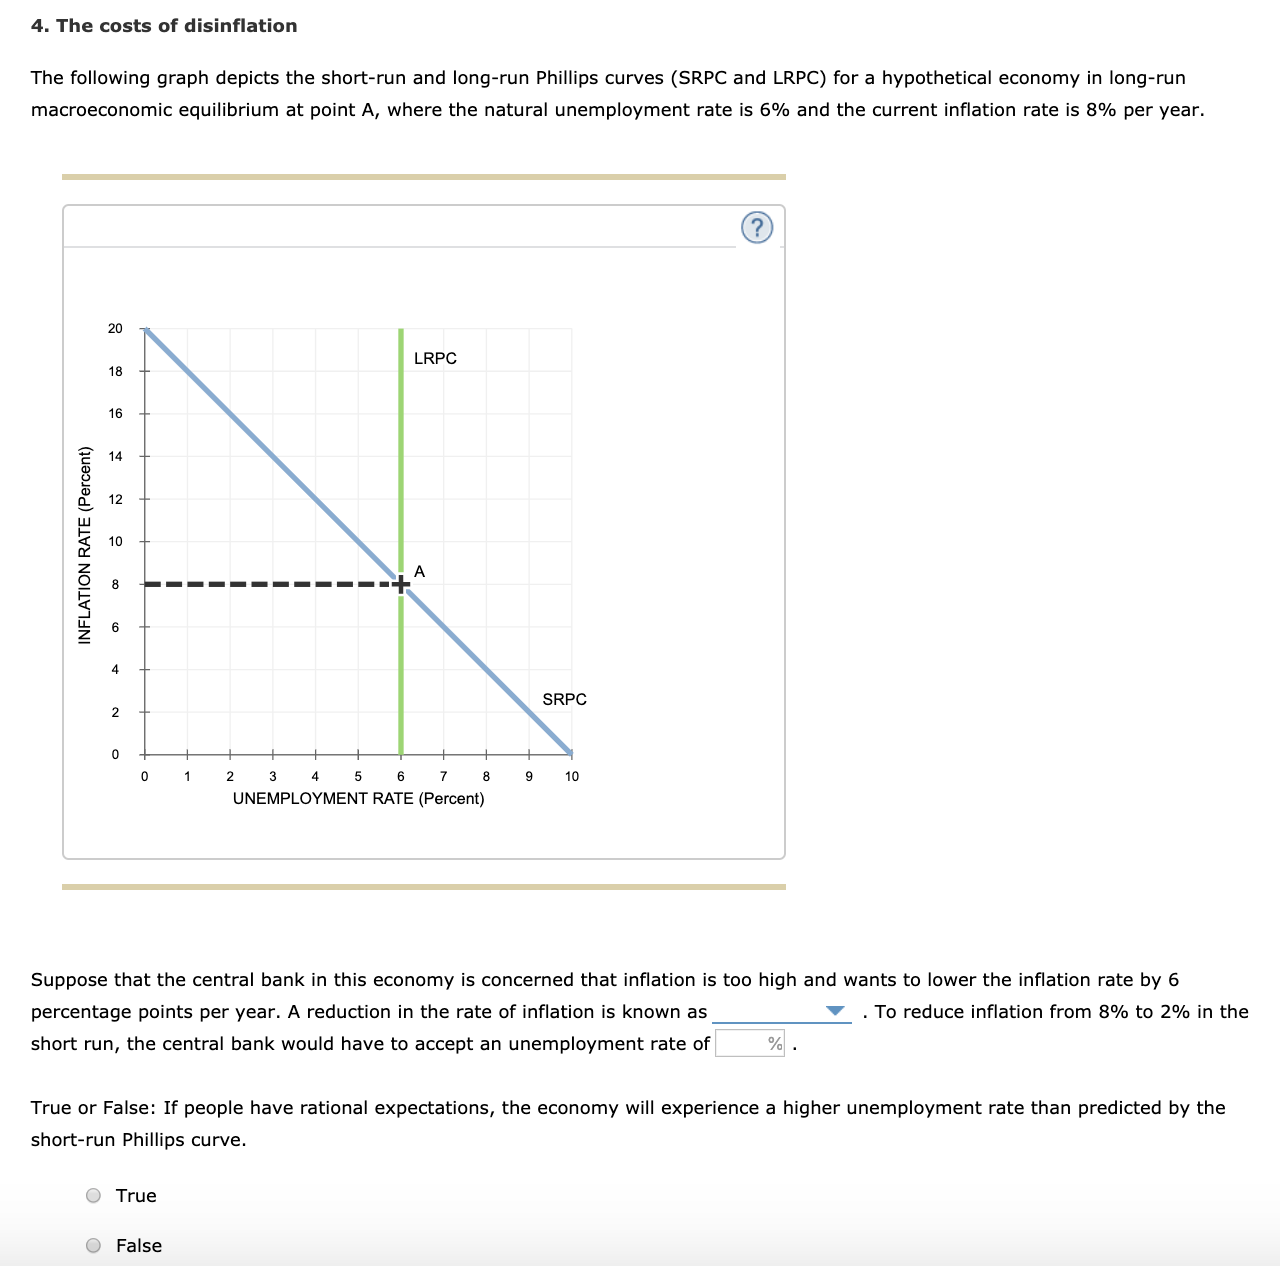
The following graph depicts the short-run and long-run Phillips curves (SRPC and LRPC) for a hypothetical economy in long-run macroeconomic equilibrium at point A, where the natural unemployment rate is 6% and the current inflation rate is 8% per year.


Q: The corresponding table includes a breakdown including Inflation Rate, Unemployment Rate, Price…
A: PART 1 The PC examines the relationship between inflation and unemployment. It demonstrates the…
Q: Consider the Phillips curve in the graph below. Start from long run equilibrium at point Assume the…
A: Answer in step 2.
Q: The following graph illustrates long-run and short-run Phillips curves for an economy that is…
A: Phillips curve is the graphical representation of the relationship between unemployment and…
Q: Include correctly labeled diagrams, if useful or required, in explaining your answers. A correctly…
A: The Phillips curve, which says that inflation and unemployment have a stable and inverse…
Q: Since the short-run Philips curve is downward sloping and the long-run Phillips curve is vertical…
A: Phillips curve states that the inflation and unemployment are inversely related.Inflationary…
Q: An increase in unemployment is seen graphically as a movement to the left along a movement to the…
A: Philips curve shows relationship between inflation rate and unemployment rate.
Q: The diagram opposite shows two short-run Phillips curves (PC0 and PC1). PC0 corresponds to a…
A: Short-term Phillips curve: The short-term Phillips curve shows that there is an exchange between…
Q: According to Mankiw Chapter 22, Friedman and Phelps believed or argued all of the following except:…
A: A.W Phillips developed the concept of Phillips curve. This curve says that there is an inverse…
Q: Assume that the economy of Country X has an actual unemployment rate of 7%, a natural rate of…
A: “Since you have posted a question with multiple sub-parts, we will solve the first three sub-parts…
Q: Graphically derive short run Phillips curve with the help of aggregate demand and supply and demand
A: The opposite relationship among joblessness and the level of price increase is displayed in the…
Q: The Phillips curve represents the trade-off between: real GDP and inflation. unemployment and…
A: In economics, different terms are used to explain the curves that provide relationship between…
Q: Explain why the Phillips Curve is drawn to show a positive relationship between aggregate output and…
A: The Phillips curve is an economic idea that helps in explaining inflation and unemployment have a…
Q: Draw a properly labelled Phillips Curve. What does it imply about the relationship between inflation…
A: Phillips curve shows a trade-off between inflation and unemployment.
Q: The Phillips curve started as an observed _____ correlation between the inflation rate and the…
A: Answer to the question is as follows :
Q: The table describes four possible outcomes for 2017, depending on the level of aggregate demand in…
A: Inflation rate is calculated by the percentage change in price index of two years.
Q: Which of the following explains why the original Phillips curve relation disappeared or, as some…
A:
Q: ips curves (SRPC and LRPC, respectively). 1. There is a fall in the natural rate of unemploy
A: Since you have posted a question with multiple sub-parts, we will solve first three subparts for…
Q: The long-run Phillips curve suggests which of the following? A. The economy always responds well to…
A: Answer: The long-run Phillips curve shows no trade-off between the unemployment rate and the…
Q: According to the modern interpretation, which of the following is true of the Phillips curve? a. It…
A: Philips curve shows the relationship between inflation and the unemployment rate. in the short run,…
Q: Explain why the Phillips Curve is drawn to show a positive relationship between aggregate output and…
A: The aggregate demand of the economy captures a negative link between inflation and real activity,…
Q: Q1 had been answered, Q2 is a continuing question. One of the image is the answer of Q1. Q2:…
A: Philips curve shows a relationship between the unemployment rate and the inflation rate in the…
Q: Assume that inflation falls significantly below expectations. Diagram both the short-run and…
A: Assuming, that inflation falls significantly below expectations, the consequences of such a drastic…
Q: In the 1970s, it was fashionable among policymakers (and sometimes still is today) to use the…
A: Meaning of Inflation: The term inflation refers to the situation under which there is an excessive…
Q: A lower natural rate of unemployment would affect the short-run Phillips curve in all of the…
A: Natural rate of unemployment: The natural rate of unemployment is the lowest level to which the…
Q: The short-run Phillips curve intersects the long-run Phillips curve where A) the actual rate of…
A: The long run Phillips curve is a vertical curve, which represents that in long run the economy is…
Q: Compare the short-run Phillips Curve and the long-run Phillips Curve.
A: The economics as a study is based upon the basic idea that the resources which are present with the…
Q: Assume that the economy self corrects to long-run equilibrium without a governmental policy. Which…
A: Answer - Need to find- Assume that the economy self corrects to long-run equilibrium without a…
Q: All of the following are likely results of a positive demand shock EXCEPT Select one: higher…
A: Positive demand shock increases the aggregate demand.
Q: The Phillips curve illustrates a trade-off between * Equity and efficiency Supply and…
A: “Since you have asked multiple question, we will solve the first three question for you. If youwant…
Q: Which of the following would shift the long-run Phillips curve to the left? a) A change in the…
A: Phillips curve shows a negative relationship between inflation and unemployment. Long run Phillips…
Q: Assume that the economy of Country X has an actual unemployment rate of 7%, a natural rate of…
A: Answer - Given in the question- Assume that the economy of Country X has an actual unemployment rate…
Q: Using the Phillips curve, illustrate how cost-push inflation affects the relationship between…
A: Inflation refers to a persistent increase in the average price levels of all goods and services over…
Q: According to the Phillips curve, the inflation rate depends on all of these EXCEPT: a. previously…
A: Phillips Curve shows the inverse relationship between inflation and unemployment rate given by A.W.…
Q: From your understanding what the Phillips curve is, is it possible for the unemployment rate to…
A: Inflation is a term used in economics to describe a situation in which the rates of products and…
Q: Explain why the Phillips Curve is drawn to show a positive relationship between aggregate output and…
A: The aggregate demand of the economy captures a negative link between inflation and real activity,…
Q: Assuming the long-run Phillips curve is vertical, a consistent increase in money supply over a…
A: A.W Phillips developed the concept of Phillips curve.
Q: Based on your understanding of the Phillips curve, explain what happens to actual inflation…
A: The natural rate of unemployment, a mix of structural and frictional unemployment, signifies the…
Q: In the Phillips curve equation, which of the following will cause an increase in the current…
A: Philip’s curve shows the relationship between the inflation rate and the unemployment rate.…
Q: How the Phillips Curve model (and associated diagram) could be modified to take account of shifts in…
A: Philips curve model was given by A. W. Philips. Philips curve shows the relationship between…
Q: Prior to the mid-1970s, many economists thought a higher rate of unemployment would reduce the…
A: According to the theory of the Phillips curve; the view of the 1960s versus today, the economist A.W…
Q: According to Modern Phillips Curve Theory, an increase in the sensitivity of inflation to changes in…
A: An explosion in AD is addressed by a shift from factor A to factor B. When AD grows, so does the…
Q: For each of the following scenarios, illustrate the effects of the development on both the short-run…
A: 1)There is a rise in the price of imported oil. Effect on short-run phillips curve and long-run…


Trending now
This is a popular solution!

Step by step
Solved in 3 steps with 1 images

- The following graph depicts the short-run and long-run Phillips curves (SRPC and LRPC) for a hypothetical economy in long-run macroeconomic equilibrium at point A, where the natural unemployment rate is 6% and the current inflation rate is 8% per year.The following graph plots the long-run Phillips curve (LRPC) and short-run Phillips curve (SRPC1SRPC1) for an economy currently experiencing long-run equilibrium at point A (grey star symbol). Which of the following is true along SRPC1SRPC1? -The actual unemployment rate is 6%. -The expected inflation rate is 5%. -The actual inflation rate is 5%. -The natural rate of unemployment is 3%. Suppose that the central bank for this economy suddenly and unexpectedly decreases the money supply in an effort to reduce inflation. As a result of this unanticipated policy action, actual inflation falls to 3%. On the previous graph, use the black point (plus symbol labeled "B") to illustrate the short-run effects of this policy. Suppose that now, after a period of 3% inflation, households and firms begin to expect that the inflation rate will persist at the level of 3%. On the previous graph, use the purple line (diamond symbol) to draw SRPC2SRPC2, the short-run Phillips curve that is…The following graph plots the long-run Phillips curve (LRPC) and short-run Phillips curve (SRPC1SRPC1) for an economy currently experiencing long-run equilibrium at point A (grey star symbol). Which of the following is true along SRPC1SRPC1? -The actual unemployment rate is 6%. -The expected inflation rate is 5%. -The actual inflation rate is 5%. -The natural rate of unemployment is 3%. Suppose that the central bank for this economy suddenly and unexpectedly decreases the money supply in an effort to reduce inflation. As a result of this unanticipated policy action, actual inflation falls to 3%. On the previous graph, use the black point (plus symbol labeled "B") to illustrate the short-run effects of this policy. Suppose that now, after a period of 3% inflation, households and firms begin to expect that the inflation rate will persist at the level of 3%. On the previous graph, use the purple line (diamond symbol) to draw SRPC2SRPC2, the short-run…
- The following graph plots the short-run and long-run Phillips curves (SRPC and LRPC, respectively) for an economy currently experiencing long-run macroeconomic equilibrium at point A, where the natural unemployment rate is 6% and the inflation rate is 8% per year. Suppose that the central bank for this economy has decided that inflation is too high and thus wants to decrease the inflation rate by 6 percentage points per year. A reduction in the rate of inflation is known as (deflation/disinflation) . To reduce inflation from 8% to 2% in the short run, the central bank would have to accept an unemployment rate of ____% True or False: If people have rational expectations, the economy may not have to endure an unemployment rate as high as predicted by the short-run Phillips curve. -True -FalseAssume the economy of Country X is operating above its full-employment output level. Using a correctly labeled graph of aggregate demand, short-run aggregate supply, and long-run aggregate supply, show the short-run equilibrium, labeling the equilibrium price level as PLe and the equilibrium output as Ye. Draw a single correctly labeled graph and show both a short-run and a long-run Phillips curve. Identify a point that could represent the short-run equilibrium in part (a) and label it as Z. Assume that the central bank of Country X wants the economy to be in full-employment equilibrium. What open-market operation should the central bank initiate? Given your answer in part (c), what will be the effect of the central bank’s open-market operation on each of the following in the short run? The nominal interest rate Employment. Explain. Assume that the real interest rate increases in Country X. Will the international value of Country X’s currency increase, decrease, or…For each of the following scenarios, illustrate the effects of the development on both the short-run and long-run Phillips curves (SRPC and LRPC, respectively). 1. There is a rise in the price of imported oil. 2. There is a fall in government spending.
- For each of the following scenarios, illustrate the effects of the development on both the short-run and long-run Phillips curves (SRPC and LRPC, respectively). (Please use the image attached) 1. There is a rise in the price of imported oil. 2. There is a fall in government spending.Assuming the long-run Phillips curve is vertical, a consistent increase in money supply over a period of years will _________________ the unemployment rate and will _________________ the inflation rate? a) decrease; increase b) increase; decrease c) increase; have no effect on d) decrease; decrease e) have no effect on; increaseAssume that the United States economy is currently in a recession in a short-run equilibrium. Draw a correctly labeled graph of the short-run and long-run Phillips curves. Use the letter X to label a point to represent the current state of the economy in recession.
- Does the short-run Phillips curve have a positive or negative slope? Explain how this slope is derived.Consider the Phillips curves depicted in the graph above. The Fed announces its intention to decrease inflation from 10 percent to 5 percent per year, and it succeeds. If expectations of inflation are not altered by the Fed's announcement, the rate of unemployment will be ________ in the short run. a)less than 5.5 percent b)5.5 percent c)between 5.5 and 7.5 percent d)7.5 percentIf the actual unemployment rate falls below the natural unemployment rate, how does the actual inflation rate change? The actual inflation rate ________. A. doesn't change, but the short-run Phillips curve shifts leftward B. rises up along the short-run Phillips curve C. doesn't change, but the expected inflation rate rises D. rises and the natural unemployment rate falls


