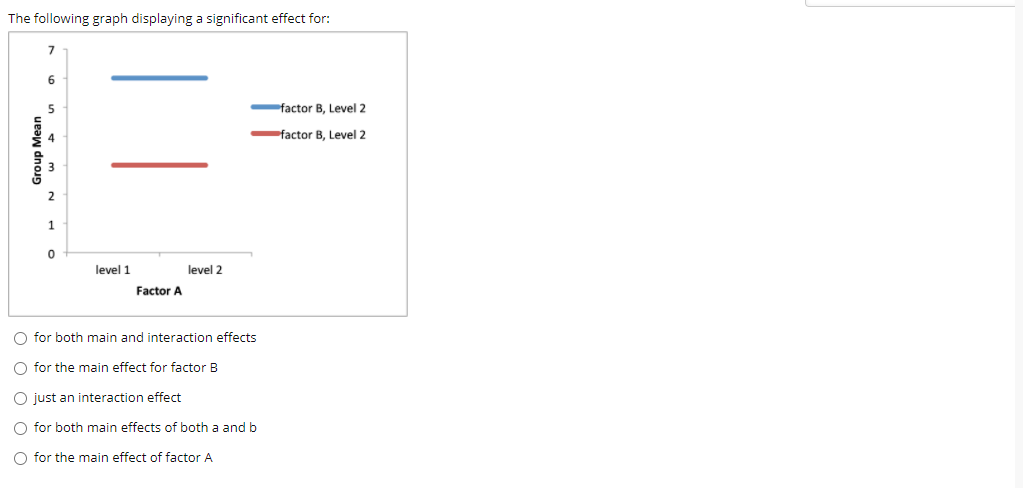
The following graph displaying a significant effect for: 7 factor B, Level 2 factor B, Level 2 level 1 level 2 Factor A for both main and interaction effects O for the main effect for factor B O just an interaction effect O for both main effects of both a and b O for the main effect of factor A Group Mean 3.


Q: Examine the following data table and indicate the presence of (a) main effect of A, (b) main effect…
A: Consider the provided data: Factor B Factor A B1 B2 A1 20 10 A2 5 20 The step by…
Q: Item 8 of 21 The following table presents the intelligence quotients of runaway boys. Number…
A: For the given data Find 5th decile class = ?
Q: argest Cities in the World Seven of the ten largest cities in the world are in the Eastern…
A: Given eastern hemisphere 37 21 26 20 23 19 22 21 21 21
Q: The following data give the percentage of women working in five companies in the retail and trade…
A: As per our guidelines, we are allowed to answer three sub-parts only. Thanks Given Data : X = %…
Q: Exhibit 15-3 Pertain to the following data. group1 group2 group3 4 11…
A: Preliminary calculation:Here, number of groups, m is 3Number of samples in each group, n is…
Q: QUESTION 2 Solve the problem. Using the information in the table on home sale prices in the city of…
A:
Q: Example 22.6 The following table gives the number of defects observed in 8 woollen carpets passed as…
A:
Q: Seven of the ten largest cities in the world are in the Eastern Hemisphere (including the largest:…
A: Given Eastern hemisphere: 37,26,23,22,21,21,21 Western hemisphere:21,20,19
Q: The question is from the below book: Book-Analysis of biological data 2nd Edition Michael C.…
A: a) Bar chart: Bar chart is the graphical way of representing the data values using bars…
Q: QUESTION 2 Carlos is investigating the effects of attractiveness on dating behavior. Each…
A: Note: Hey there! Thanks for posting the question. Since your question has more than one question, we…
Q: QUESTION 2 Banila Co. selected 1,000 young adults at random and surveyed them to determine a…
A: I can only answer one question and only solve first 3 sub parts of the question. This is guidelines…
Q: This question refer to the following data: Sentence Year. 13 10 8 6 4 7 14 9. 7 What is the mode?…
A: Given data, 13,10,8,6,4,7,14,9,7 Mode=?
Q: The following data represent the means for each treatment condition in a two-factor experiment. Note…
A: Given: For each treatment condition follows the two factor experiment. To determine the value of the…
Q: Question 1 of 10 Consider the graphs below. What are the response variables? Temperature Time Length…
A: A response variable is a variable whose variation depends on the other variables. This means the…
Q: Question 12 The boxplot below shows salaries for CPAS and Actuaries in a town. CPA Actuary 20 30 40…
A: Given Q1 of cpa is,35 thousands Q1 of actuaries is 65 thousands
Q: A country club wants to exam the effects of a new marketing campaign that attempts to get more…
A:
Q: a. assuming that this sample is random/representative of the population, what other assumptions need…
A:
Q: Question two A researcher is proposing that exercise makes a person more energized and this results…
A: Given: n = 8 Formula Used: Correlation coefficient r = n∑XY-∑X∑Yn∑X2-∑X2n∑Y2-∑Y2 Coefficient of…
Q: You may need to use the appropriate technology to answer this question. A factorial experiment…
A: The data table shows two levels of factor A and three level of factor B.
Q: Which of the following statements about the comparison between effect size and power is correct?…
A: Given : Effect Size : This is the no. measures the strength of the relationship between 2…
Q: Section 1-Question 13 Jennifer asked 50 students if they preferred dogs or cats. The table shows the…
A:
Q: A recent study indicates that simply giving college students a pedometer can result increased…
A: Given that,
Q: Question 6 You recently performed a survey regarding the popularity of four fast food restaurants.…
A: Data visualization is the process of denoting the numerical data visually. Data visualization can be…
Q: In the Focus Problem at the beginning of this chapter, a study was described comparing the hatch…
A: (a) To find out point estimate P1 = x1n1 = 272489 = 0.5562 95% confidence interval of P1 α…
Q: The amounts withdrawn from an ATM are recorded over a single day. $20 $60 $100 $ 20 $80 $ 40 $50 $20…
A: Given information: The data represents the amounts that are withdrawn from an ATM.
Q: QUESTION 12 Obtain the five-number summary for the given data. The National Education Association…
A: Given that, Total number of observations = 19
Q: Question 3 a. Management of a nationwide Australian bank organised for a survey of its clients to…
A: Sample Size, n = 2,500 Of the completed surveys, 875 indicated that the client was satisfied with…
Q: Question 2 Based on the scatterplot below, it appears there is at least one candidate outlier in…
A: Correlation A correlation coefficient is a statistical technique to assess the magnitude of the…
Q: This problem demonstrates a possible (though rare) situation that can occur with group comparisons.…
A: Given Section 1 Section 2 Section 3 77 66.9 80.7 84.8 71.8 79.4 93.3 88.9 83.3 87.6 73.2…
Q: Question 3 Obtain the five-number summary for the given data. The test scores of 15 students are…
A: It is an important part of statistics. It is widely used.
Q: Question 11 Stacey Davis, chairman of a college's business department, has decided to assign…
A:
Q: Question 3 A study was conducted to determine the differences in the average weight loss of four…
A:
Q: Suppose instead, you obtained the following data: Morning Testing M= 19 Afternoon Testing M= 12…
A: Solution : Given : Morning testing Afternoon testing Older adults 19 12 Younger Adults 19…
Q: The accompanying table lists the numbers of words spoken in a day by each member of 56 different…
A: The data shows the numbers of words spoken in a day by each member of 56 different randomly selected…
Q: Question 3 A study was conducted to determine the differences in the average weight loss of four…
A: Given Information: Consider the given data that shows the average weight loss of four groups of…
Q: Eleven sets of fraternal twins are tracked to see the number of years of education the results are…
A:
Q: This problem demonstrates a possible (though rare) situation that can occur with group comparisons.…
A: Given there are 3 independent samples which are section 1, section 2 and section 3. To test whether…
Q: Suppose instead, you obtained the following data: Afternoon Testing Morning Testing M= 15 Older…
A: Given: Morning Testing Afternoon Testing Older Adults 15 15 Younger Adults 19 20
Q: Question Four If employees' salaries ( in hundred £) in company ABC are as follows: 11, 15, 17, 14,…
A: The salaries of 10 employees is given: X X2 11 121 15 225 17 289 14 196 16 256 16 256…
Q: In the Focus Problem at the beginning of this chapter, a study was described comparing the hatch…
A: “Since you have posted a question with multiple sub-parts, we will solve first three sub-parts for…
Q: Question 3 A study was conducted to determine the differences in the average weight loss of four…
A: ANOVA study is an appropriate test to determine the difference in averages of more than two groups.…
Q: Question 3 A researcher is proposing that exercise makes a person more energized as a result they…
A:
Q: A study was conducted to determine the proportion of people who dream in black and white instead of…
A: Given dataA study was conductedAmong 302 people over the age of 558 dream in black and whiteAmong…
Q: A researcher is proposing that exercise makes a person more energized as a result they require less…
A: Given information and calculation is shown below Average hours of sleep needed/night(x)…
Q: (a) The researcher is concerned that older persons may not be knowledgeable of the COFLU-20. As…
A: The claim is that check whether there is an association exists between age group and knowledge…
Q: Question Four If employees' salaries ( in hundred £) in company ABC are as follows: 11, 15, 17, 14,…
A: Employees salaries are given by: 11, 15, 17, 14, 16, 16, 14, 18, 17, 12 And the marks of…
Q: Question 3: The American Association of Individual Investors (AAII) On-Line Discount Broker Survey…
A: Since you have posted a question with multiple sub-parts, we will solve first three sub- parts for…
Q: QUESTION 17 Obtain the five-number summary for the given data. The test scores of 15 students are…
A: The given test scores of 15 students are: 40,46,49,54,56,62,67,70,73,77,85,87,90,94,95. We have to…
Q: QUESTION 2 Banila Co. selected 1,000 young adults at random and surveyed them to determine a…
A: Probability is defined as the total number of favorable cases of an event divided by the total…
Q: (a) The researcher is concerned that older persons may not be knowledgeable of the COFLU-20. As…
A:


Trending now
This is a popular solution!

Step by step
Solved in 2 steps


- The Minister of National Security in Trinidad and Tobago is interested in determining the factors that influence the number of crimes that are reported. You are tasked to develop a model using the appropriate variables. The following variables are utilized: X1 X2 X3 X4 X5 X6 478 184 74 11 31 20 494 213 72 11 43 18 643 347 70 18 16 16 341 565 71 11 25 19 773 327 72 9 29 24 603 260 68 8 32 15 484 325 68 12 24 14 546 102 62 13 28 11 424 38 69 7 25 12 548 226 66 9 58 15 506 137 60 13 21 9 819 369 81 4 77 36 541 109 66 9 37 12 491 809 67 11 37 16 514 29 65 12 35 11 371 245 64 10 42 14 457 118 64 12 21 10 437 148 62 7 81 27 570 387 59 15 31 16 432 98 56 15 50 15 619 608 46 22 24 8 357…In the Focus Problem at the beginning of this chapter, a study was described comparing the hatch ratios of wood duck nesting boxes. Group I nesting boxes were well separated from each other and well hidden by available brush. There were a total of 489 eggs in group I boxes, of which a field count showed about 272 hatched. Group II nesting boxes were placed in highly visible locations and grouped closely together. There were a total of 821 eggs in group II boxes, of which a field count showed about 262 hatched. (a) Find a point estimate p̂1 for p1, the proportion of eggs that hatch in group I nest box placements. (Round your answer to four decimal places.) p̂1 = Find a 95% confidence interval for p1. (Round your answers to three decimal places.) lower limitupper limit (b) Find a point estimate p̂2 for p2, the proportion of eggs that hatch in group II nest box placements. (Round your answer to four decimal places.) p̂2 = Find a 95% confidence interval for p2. (Round your…In the Focus Problem at the beginning of this chapter, a study was described comparing the hatch ratios of wood duck nesting boxes. Group I nesting boxes were well separated from each other and well hidden by available brush. There were a total of 485 eggs in group I boxes, of which a field count showed about 274 hatched. Group II nesting boxes were placed in highly visible locations and grouped closely together. There were a total of 790 eggs in group II boxes, of which a field count showed about 262 hatched. (a) Find a point estimate p̂1 for p1, the proportion of eggs that hatch in group I nest box placements. (Round your answer to three decimal places.)p̂1 = Find a 95% confidence interval for p1. (Round your answers to three decimal places.) lower limit upper limit (b) Find a point estimate p̂2 for p2, the proportion of eggs that hatch in group II nest box placements. (Round your answer to three decimal places.)p̂2 = Find a 95% confidence interval for p2. (Round…
- Which of the following is the largest number of jobs that could theoretically be within the software industry at present, based on the information available? A) 1,4 million B) 2,4 million C) 4 million D) 8 million E) 10 millionA health researcher studying child birth is interested in the possible effect that smoking by the mother during pregnancy has on the baby's birth weight. To investigate, the researcher conducts an observational study by reviewing 400 records of women in their twenties who have recently given birth for the first time. For each record, he notes whether or not the woman smoked during pregnancy and the baby's birth weight, in addition to the woman's education level, and age. From the data, the researcher creates two groups: women in their twenties who smoked during pregnancy and women in their twenties who did not smoke during pregnancy. Then he compares the average birth weight between the two groups. (a)Why might the researcher have chosen to perform an observational study (by gathering information from past records) and not a randomized experiment (by assigning pregnant women to either the smoking or nonsmoking group at random)? Choose the best answer from the choices below. In a…Which of the following is a benefit of a within-groups design over a between-groups design?
- In Figure 11.5, we show three combinations of main effects and interactions for a 2 X 2 factorial design. Using the same 2 X 2 structure, with factor A defining the rows and factor B defining the columns, create a set of means that produce each of the following patterns: The main effect for factors A and B, but no interaction. The main effect for factor A and interaction, but no main effect for factor B. The main effect for both factors and interactionThe source depicts the results of a fictional study investigating whether the number of hours of sleep a person gets varies with his or her gender(male,female) and with the number of energy drinks that he or she consumes in a day. Equal numbers of men and women were randomly assigned to drink either 0, 1, or 2 energy drinks during the course of a day and then record the number of hours they slept that night. Table: Coffee and Sleep Source SS df MS F Gender 0.250 1 0.250 0.283 Energy Drinks 81.556 2 40.778 46.180 Gender X Drinks 2.667 2 1.330 1.510 Within…The source table depicts the results of a fictional study investigating whether the number of hours of sleep a person gets varies with his or her gender (male, female) and with the number of energy drinks that he or she consumes in a day. Equal numbers of men and women were randomly assigned to drink either 0, 1, or 2 energy drinks during the course of a day and then record the number of hours they slept that night. Table: Coffee and Shop Source SS df MS F Gender 0.250 1 0.250 0.283 Energy Drinks 81.556 2 40.778 46.180 Gender X Drinks 2.667 2 1.330 1.510 Within…
- The exercise involving data in this and subsequent sections were designed to be solved using Excel. Johnson Filtration, Inc. provides maintenance service for water-filtration systems. Suppose that in addition to information on the number of months since the machine was serviced and whether a mechanical or an electrical repair was necessary, the managers obtained a list showing which repairperson performed the service. The revised data follow. Repair Time(hours) Months SinceLast Service Type ofRepair Repairperson 2.9 2 electrical Dave Newton 3.0 6 mechanical Dave Newton 4.8 8 electrical Bob Jones 1.8 3 mechanical Dave Newton 2.9 2 electrical Dave Newton 4.9 7 electrical Bob Jones 4.2 9 mechanical Bob Jones 4.8 8 mechanical Bob Jones 4.4 4 electrical Bob Jones 4.5 6 electrical Dave Newton Ignore for now the months since the last maintenance service (x1 ) and the repairperson…The National Highway Association is studying the relationship between the number of bidders on a highway project and the winning (lowest) bid for the project. Of particular interest is whether the number of bidders increases or decreases the amount of the winning bid. Bidders Price 9.0 5.1 9.0 8.0 3.0 9.7 10.0 7.8 5.0 7.7 10.0 5.5 7.0 8.3 11.0 5.5 6.0 10.3 6.0 8.0 4.0 8.8 7.0 9.4 7.0 8.6 7.0 8.1 6.0 7.8 Given: Correlation of Coefficient: 0.7064 (This is correct) Coefficient of determination: 49.90% (This is correct) ŷ = 11.2360 + (-0.4667)x (This is correct) Create a scatter plot of the data Complete a regression analysis of the relationship. Slope = ______ Estimate the winning bid if there were seven bidders. Winning bid cost ______ millions. Compute the 95% prediction interval for a winning bid if there are seven bidders. [ _____________, ______________]