The following data give the percentage of women working in five companies in the retail and trade industry. The percentage of management jobs held by women in each company is also shown. % Working 67 45 73 55 61 50 21 66 47 33 Management a. From the following select the appropriate scatter diagram for these data with the percentage of women working in the company as the independent variable. Scatter diagram a %Management 60 50 40 30 20 10
The following data give the percentage of women working in five companies in the retail and trade industry. The percentage of management jobs held by women in each company is also shown. % Working 67 45 73 55 61 50 21 66 47 33 Management a. From the following select the appropriate scatter diagram for these data with the percentage of women working in the company as the independent variable. Scatter diagram a %Management 60 50 40 30 20 10

Glencoe Algebra 1, Student Edition, 9780079039897, 0079039898, 2018
18th Edition
ISBN:9780079039897
Author:Carter
Publisher:Carter
Chapter4: Equations Of Linear Functions
Section4.5: Correlation And Causation
Problem 2CYU

Related questions
Question
17. The following data give the percentage of women working in five companies in the retail and trade industry. The percentage of management jobs held by women in each company is also shown.
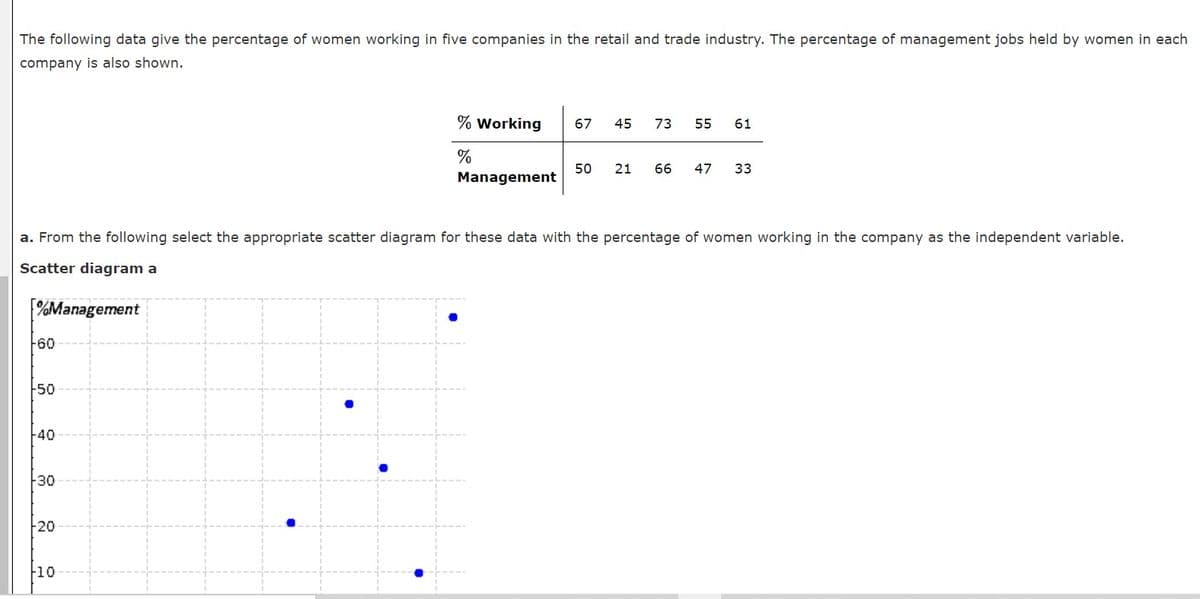
Transcribed Image Text:The following data give the percentage of women working in five companies in the retail and trade industry. The percentage of management jobs held by women in each
company is also shown.
% Working
67
45
73
55
61
50
Management
21
66
47
33
a. From the following select the appropriate scatter diagram for these data with the percentage of women working in the company as the independent variable.
Scatter diagram a
%Management
60
50
40
30
20
10
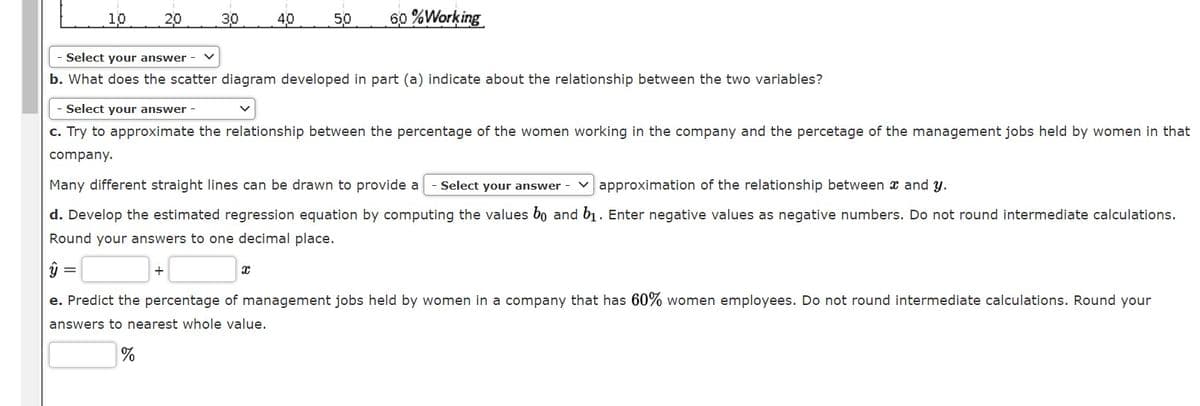
Transcribed Image Text:10
20
30
40
50
60 %Working
Select your answer -
b. What does the scatter diagram developed in part (a) indicate about the relationship between the two variables?
Select your answer -
c. Try to approximate the relationship between the percentage of the women working in the company and the percetage of the management jobs held by women in that
company.
Many different straight lines can be drawn to provide a
Select your answer -
v approximation of the relationship between x and y.
d. Develop the estimated regression equation by computing the values bo and b1. Enter negative values as negative numbers. Do not round intermediate calculations.
Round your answers to one decimal place.
+
e. Predict the percentage of management jobs held by women in a company that has 60% women employees. Do not round intermediate calculations. Round your
answers to nearest whole value.
Expert Solution
This question has been solved!
Explore an expertly crafted, step-by-step solution for a thorough understanding of key concepts.

This is a popular solution!

Trending now
This is a popular solution!

Step by step
Solved in 2 steps with 1 images

Recommended textbooks for you
Glencoe Algebra 1, Student Edition, 9780079039897…
Algebra
ISBN:
9780079039897
Author:
Carter
Publisher:
McGraw Hill

Functions and Change: A Modeling Approach to Coll…
Algebra
ISBN:
9781337111348
Author:
Bruce Crauder, Benny Evans, Alan Noell
Publisher:
Cengage Learning
Glencoe Algebra 1, Student Edition, 9780079039897…
Algebra
ISBN:
9780079039897
Author:
Carter
Publisher:
McGraw Hill
Functions and Change: A Modeling Approach to Coll…
Algebra
ISBN:
9781337111348
Author:
Bruce Crauder, Benny Evans, Alan Noell
Publisher:
Cengage Learning