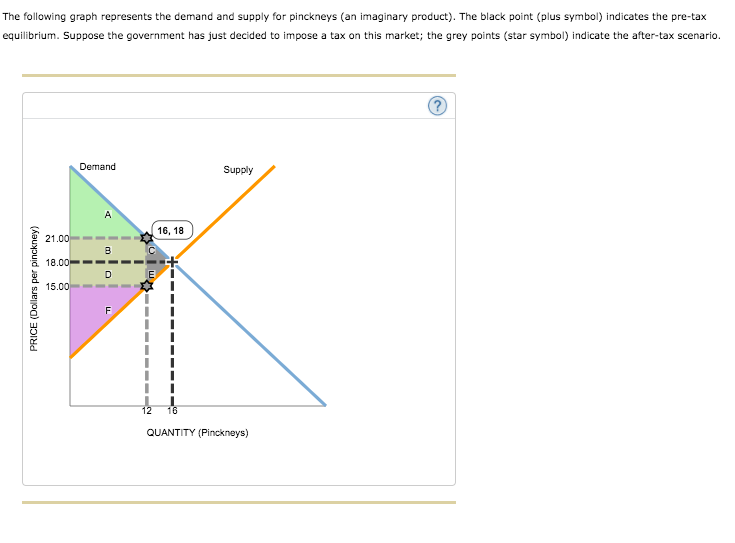
The following graph represents the demand and supply for pinckneys (an imaginary product). The black point (plus symbol) indicates the pre-tax equilibrium. Suppose the government has just decided to impose a tax on this market; the grey points (star symbol) indicate the after-tax scenario. Demand Supply A 16, 18 21.00 18.00 D E 15.00 F PRICE (Dollars per pinckney)
The following graph represents the demand and supply for pinckneys (an imaginary product). The black point (plus symbol) indicates the pre-tax equilibrium. Suppose the government has just decided to impose a tax on this market; the grey points (star symbol) indicate the after-tax scenario. Demand Supply A 16, 18 21.00 18.00 D E 15.00 F PRICE (Dollars per pinckney)

Essentials of Economics (MindTap Course List)
8th Edition
ISBN:9781337091992
Author:N. Gregory Mankiw
Publisher:N. Gregory Mankiw
Chapter6: Supply, Demand And Government Policies
Section: Chapter Questions
Problem 6CQQ

Related questions
Question
Transcribed Image Text:The following graph represents the demand and supply for pinckneys (an imaginary product). The black point (plus symbol) indicates the pre-tax
equilibrium. Suppose the government has just decided to impose a tax on this market; the grey points (star symbol) indicate the after-tax scenario.
Demand
Supply
A
16, 18
21.00
18.00-
D
E
15.00
F
12
16
QUANTITY (Pinckneys)
PRICE (Dollars per pinckney)
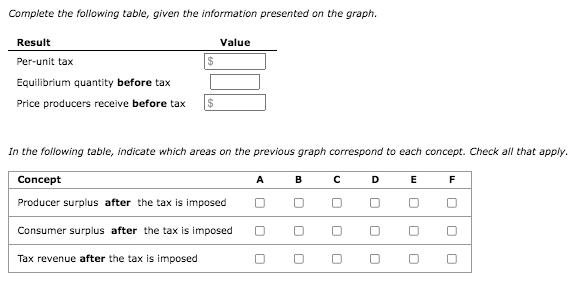
Transcribed Image Text:Complete the following table, given the information presented on the graph.
Result
Value
Per-unit tax
2$
Equilibrium quantity before tax
Price producers receive before tax
2$
In the following table, indicate which areas on the previous graph correspond to each concept. Check all that apply.
Concept
DE F
A
в
Producer surplus after the tax is imposed
Consumer surplus after the tax is impose
Tax revenue after the tax is imposed
Expert Solution
This question has been solved!
Explore an expertly crafted, step-by-step solution for a thorough understanding of key concepts.

This is a popular solution!

Trending now
This is a popular solution!

Step by step
Solved in 3 steps with 1 images

Recommended textbooks for you
Essentials of Economics (MindTap Course List)
Economics
ISBN:
9781337091992
Author:
N. Gregory Mankiw
Publisher:
Cengage Learning

Principles of Microeconomics
Economics
ISBN:
9781305156050
Author:
N. Gregory Mankiw
Publisher:
Cengage Learning

Essentials of Economics (MindTap Course List)
Economics
ISBN:
9781337091992
Author:
N. Gregory Mankiw
Publisher:
Cengage Learning
Principles of Microeconomics
Economics
ISBN:
9781305156050
Author:
N. Gregory Mankiw
Publisher:
Cengage Learning


Macroeconomics: Private and Public Choice (MindTa…
Economics
ISBN:
9781305506756
Author:
James D. Gwartney, Richard L. Stroup, Russell S. Sobel, David A. Macpherson
Publisher:
Cengage Learning